Start with the practical answer. The main subject is not a new name for a solar cell, but a way to make its material. The researchers developed room-temperature LTRI synthesis of FAPbI₃ nanocrystals, used robotic experiments and machine learning to narrow the conditions, and connected the chemistry to continuous flow and working devices. Beyond the champion efficiency of 19.37%, the important question is whether a formulation found in a small experiment survives an increase in production scale.[1]
#Reading original Figure 1: measurements and predictions are different
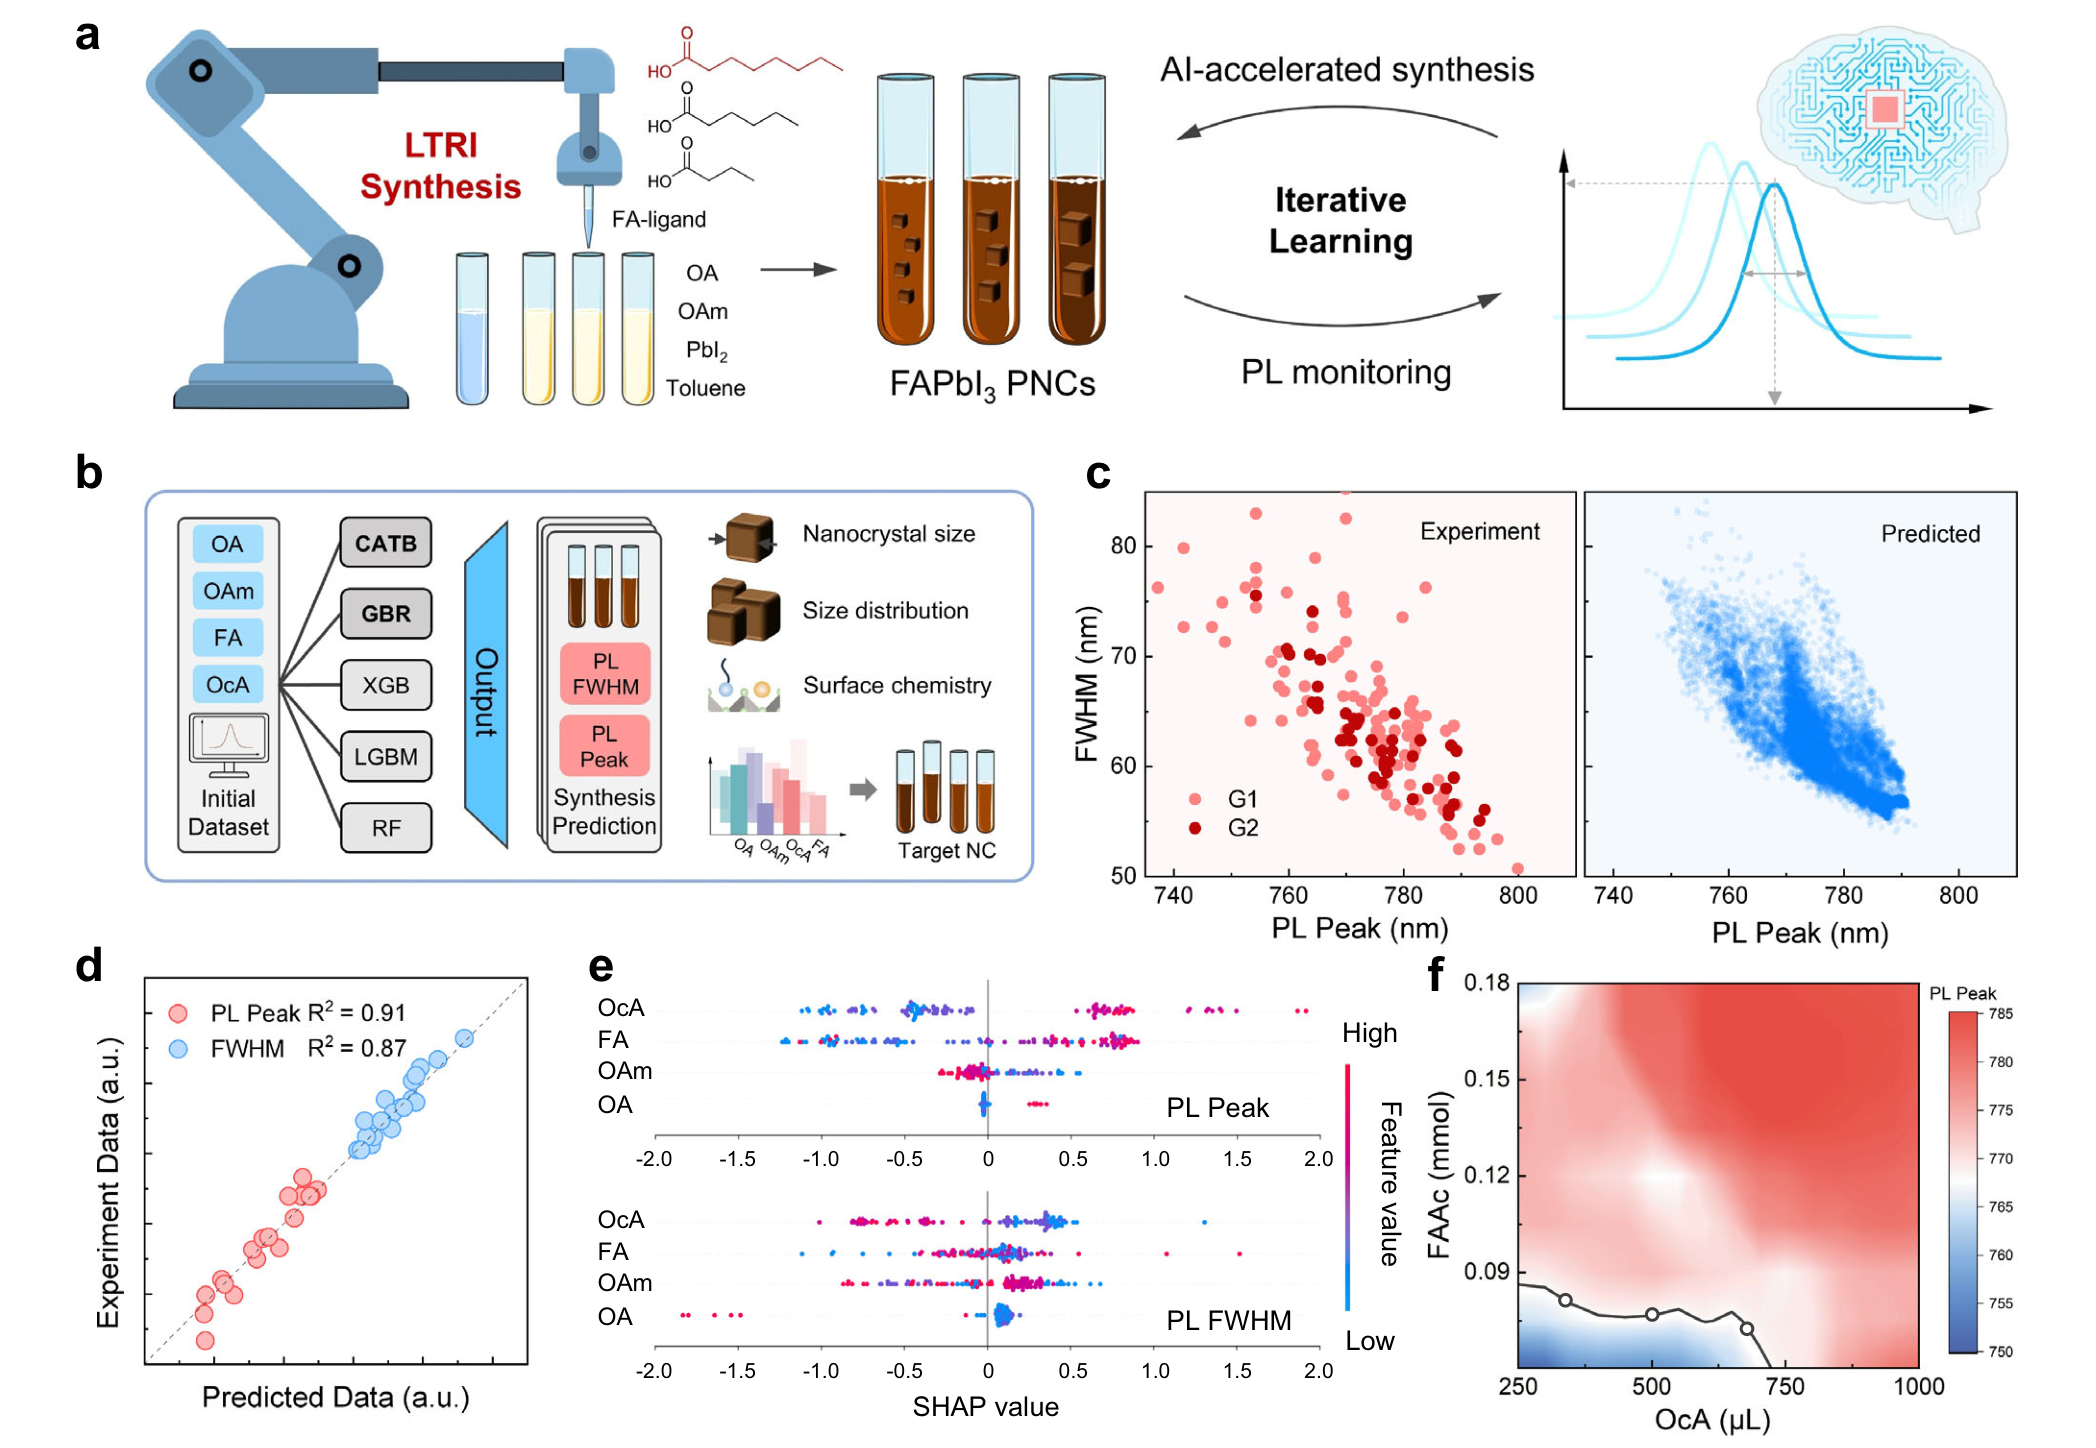
Panels a and b connect automated synthesis to measurement. The left of c contains photoluminescence measurements from the initial 109 and additional 45 experiments; the right contains predictions for approximately 16,000 formulations. Those predicted points are not 16,000 synthesized samples. Panel d compares predictions with measurements for 20 separately selected reactions. Panel e uses SHAP to interpret contributions within the trained model, while f maps predicted behavior across OcA and FAAc combinations. Crucially, that map is not a map of solar-cell efficiency.[1]
Start here Nanocrystals, ligands and PL from first principles Open the explanation
A nanocrystal is a very small crystalline particle. Here it forms a material that absorbs light and generates charge. In FAPbI₃, FA stands for formamidinium, Pb for lead and I for iodine. Particle-size distribution and surface condition matter alongside composition. A ligand binds to a surface or precursor and changes reaction behavior or stability. Adding more ligand does not necessarily improve every property.
Photoluminescence, or PL, measures light emitted after a material is illuminated. The PL peak is the wavelength of strongest emission. FWHM is the width of the peak at half its maximum height. These measurements help characterize the particle population, but cannot alone determine charge extraction, electrode contacts and electrical power conversion. This study’s models predict these relatively accessible optical measurements.[1][2]
#1. Finding a good material is not the same as reproducing it
Hot injection (HI) introduces precursors into a heated reaction mixture to control nucleation and growth. Repeated gas removal, heating, injection and cooling must be coordinated. A larger vessel changes mixing and heat transfer, so using the same material name does not ensure the same particle distribution. The study addresses this transition between a successful laboratory formulation and a more scalable process.[1]
LTRI stands for ligand-triggered room-temperature injection. Short-chain octanoic acid (OcA) changes precursor reactivity and surface interactions, enabling nucleation at room temperature. The researchers then explore four inputs: OA, OAm, FAAc and OcA—oleic acid, oleylamine, formamidinium acetate and octanoic acid. These are the variables explored within an experimental system where other quantities, including the lead precursor, were held fixed.[1][2]
Editorial note. The supplied draft emphasized ambient-storage stability. During this update, the original paper’s Figure 4 was also checked and found to include maximum-power-point operation and thermal testing. The storage result is retained below, but all three tests are distinguished. The edition date is 3 October 2026; the source recheck and publication work took place on 5 October.
#2. The AI learns optical properties, not device efficiency
The robot synthesizes different formulations and measures their PL spectra. The paper describes training the first model, G1, on 109 valid observations, excluding inappropriate spectra associated with multiple peaks or aggregation. Another 45 observations expand the G2 dataset to 154. That is not necessarily the total number of attempted reactions including every failure. The inclusion and exclusion criteria help define the domain in which the model has been evaluated.[1][2]
The supplement compares Random Forest, Gradient Boosting, XGBoost, LightGBM and CatBoost, using Optuna’s TPE search, 30 hyperparameter trials and three-fold cross-validation. In the subsequent experimental comparison of 20 reactions, R² was approximately 0.91 for PL peak position and 0.87 for FWHM. These are optical prediction scores on the validation set, not statements that 91% of candidates became successful solar cells.[1][2]
Does R² of 0.91 mean a 91% success rate? Expand symbols and the worked calculation
No. Here y is a measurement, ŷ a prediction, and ȳ the evaluation-set mean. The numerator sums squared prediction errors; the denominator is the squared error from predicting the mean throughout. For an illustration, a denominator of 100 and numerator of 9 give R²=1−9/100=0.91. These illustrative totals are not a refit of the paper’s data. A different output range or experimental domain can change R² even for the same model. A high value does not establish trustworthy extrapolation beyond the tested formulation range.
Screening approximately 16,000 virtual formulations narrows a region worth investigating; it does not certify those formulations without experiments. The study particularly examines the balance of OcA and FAAc in relation to nucleation, growth and particle distribution. A large SHAP contribution identifies an important input within a fitted model, not necessarily a unique physical cause. Such interpretation needs to be read alongside chemical measurements. PCE, lifetime, lead leakage and cost were not jointly optimized as direct model targets.[1]
#3. Separate the champion, the distribution and the 1 L check
A champion is the best device obtained under specified conditions. A mean and its dispersion reveal a different aspect of repeatability. Supplementary Tables 6 and 8 separate devices made using HI, small-scale LTRI and 1 L flow-produced material. The ± values below retain the paper’s notation; they are not reinterpreted as confidence intervals for the yield of an entire factory.[2]
| Material and process | Champion PCE | Mean device PCE | Devices in the mean |
|---|---|---|---|
| Conventional HI | 17.22% | 16.58±0.40% | 30 |
| Small-scale LTRI | 19.37% | 18.98±0.19% | 30 |
| 1 L flow-synthesized LTRI | 18.87% | 18.49±0.14% | 12 |
For the small-scale LTRI champion, forward-scan PCE was 19.11%, distinct from the reverse-scan 19.37%. The slightly lower champion from 1 L material still provides evidence that performance did not collapse during scale-up. However, 12 devices do not establish all batch variation, long-duration reactor performance or uniformity at arbitrary module area. One litre is meaningful laboratory scale-up, not a record of tonne-scale factory production.[1][2]
#Reading original Figure 4: efficiency beside durability
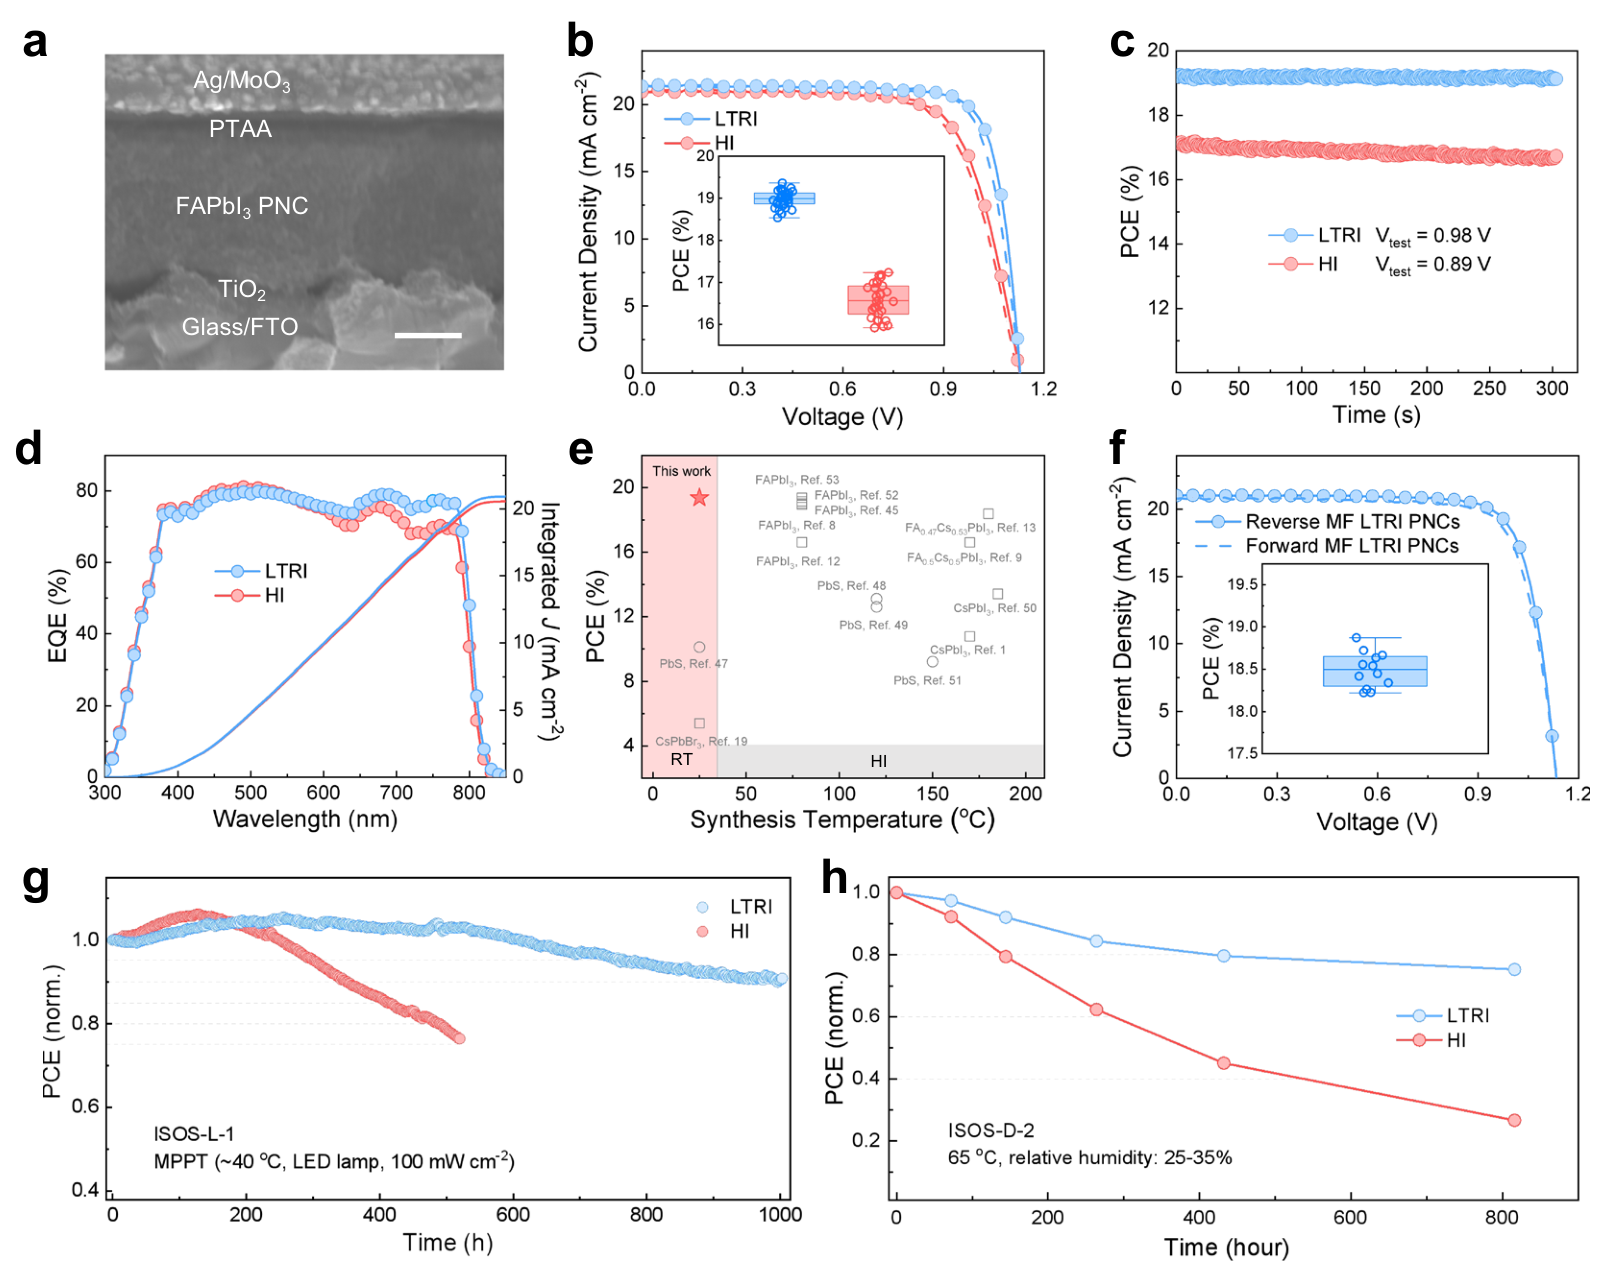
Panel a shows a device cross section; b contains current–voltage curves and the 30-device distribution; c shows short-term stabilized output; and d examines wavelength-dependent quantum efficiency. Panel f reports devices from 1 L material. The final panels are different tests: g tracks maximum-power-point operation under light, while h measures thermal stability in the dark. Their vertical axes show efficiency normalized to its initial value, not absolute PCE. Neither is identical to storage aging in Supplementary Figure 23.[1]
#4. What is added together to obtain 2.16 dollars per gram?
The Flow-LTRI estimate adds 1.29 dollars per gram for synthesis materials, 0.78 for purification and 0.09 for labor, producing approximately 2.16 dollars per gram. HI combines approximately 13.74 dollars per gram in synthesis and purification materials with 105.06 in labor, or approximately 118.8; the abstract reports 118.81. This large difference depends on process time, throughput and pricing assumptions, rather than the performance of a catalyst alone.[1][2]
Why does automation reduce the estimated labor contribution? Expand symbols and the worked calculation
The hourly wage is w, the operator count N, and hourly output q. Substituting the supplement’s 27 dollars per hour, one operator and estimated throughput of 290.25 grams per hour gives approximately 0.093 dollars per gram. This calculation assumes the specified throughput and accounting boundary. It also treats additional oversight of automated synthesis as negligible and excludes unattended precursor-preparation time from labor. The expression does not demonstrate that a real round-the-clock factory needs only one worker.[2]
Another important asymmetry is that HI and small-scale LTRI use laboratory-scale chemical prices, while Flow-LTRI uses industry-scale prices. The calculation is not an audited commercial cost of goods sold covering equipment investment and depreciation, energy, quality control, waste treatment, packaging and factory overhead. The ratio 118.81/2.16≈55 applies inside this cost model; it is not a 55-fold reduction in the cost of electricity generated by commercial photovoltaics. Dollars per gram of material and dollars per watt of finished module also have different denominators.[2]
#5. Read the three stability experiments separately
The storage numbers in the supplied draft agree with Supplementary Figure 23. The accepted paper additionally reports operational and thermal experiments. Rather than presenting one result as field lifetime—or claiming that no operating test was performed—the conditions should be separated.[1][2]
| Test | Conditions | Initial PCE retained by LTRI |
|---|---|---|
| Ambient storage | Unencapsulated devices, 25–30°C and 15–20% relative humidity; Supplementary Figure 23 | More than 90% after 1,000 h |
| MPP operation | Unencapsulated devices with a gold top electrode, continuous one-sun LED illumination at approximately 40°C; Figure 4g | Approximately 85% after 1,000 h |
| Thermal stability | Unencapsulated devices, darkness at 65°C; Figure 4h | 75.3% after 800 h |
Maximum-power-point tracking operates near the voltage delivering the most electrical power and follows performance over time. It is stronger operational evidence than storage alone. Yet a small device under a particular light source and temperature is not equivalent to long outdoor module life, a high-humidity damp-heat campaign or comprehensive module qualification. Initial PCE also differs between these tests. Automatically multiplying each normalized retention by the 19.37% champion value would combine results from different devices.[1]
#6. What remains before this becomes a manufacturing platform
The process question is whether mixing, residence time, contamination control and particle distributions remain stable in larger reactors and during sustained production. Repeated batches and longer continuous runs need device averages, defect rates and variation. For AI, further work should extend beyond optical prediction toward objectives combining efficiency, operating stability and cost, while accounting for failed formulations. Current validation does not justify assuming transfer to new equipment or raw-material batches without further evidence.
The environmental-management problem of a lead-containing material also remains. Leakage prevention, recovery and solvent treatment belong in real process assessment. This does not dismiss every result simply because lead is present; it distinguishes a successful device experiment from validated manufacturing, use and disposal. Independent process reproduction and long-duration module tests would materially strengthen the next judgment.
The authors declare no competing interests. Source Data and supplementary information are available, but a separate ML-code repository was not identified in the publisher materials checked for this update. Availability of data is not the same as independent reproduction of the whole robotic and analytical workflow.[1][2]
#7. Why this is the lead article in this edition
The editorial interest lies in the connection robotic experiments → optical prediction → chemical understanding → flow synthesis → photovoltaic devices. This is a case of joining laboratory formulation search to process development, not an announcement that a commercial factory has been completed. The supplied editorial score of 98 is neither an official award nor a probability of scientific success.
The precise conclusion is not that AI has finished photovoltaic manufacturing. Room-temperature chemistry was explored through robotic experiments and connected to scale-up, device measurements and several stability tests. Explaining both the cost boundary and the experiments actually performed preserves the contribution without erasing its limits. Independent manufacturing repetition and comparisons with complete system boundaries matter more for the next milestone than one additional decimal place in champion efficiency.
#Sources and verification scope
[1] Zhao et al., AI-accelerated scalable synthesis of nanocrystals for cost-effective photovoltaics, Nature Communications, 2 October 2026, DOI 10.1038/s41467-026-78268-4. Peer-reviewed accepted early version; Figures 1 and 4 and the stability discussion checked on 5 October 2026. Publisher article.
[2] Supplementary Information to the same paper: ML construction, Tables 3–6 and 8 for prices, throughput and device statistics, and Supplementary Figure 23 for ambient storage. Supplement.
This explainer follows the supplied selection and questions, checked against the publisher PDF and relevant supplementary material. The accepted version may be replaced by the edited record. No complete reanalysis of Source Data, independent synthesis or module qualification was performed. Figures retain all original panels, axes and colors, with attribution and CC BY-NC-ND 4.0 notices. This is a translation of the blog’s own explainer, not an unauthorized full translation of the paper. This article does not display advertising.