Start with the practical answer. When a robot’s depth camera measures objects behind a glass door, the physical glass surface can disappear from its map. GlassRecon combines structural information from a depth foundation model with the distance scale of a depth sensor. Instead of training a new glass-specific detector, it generates alignment candidates from relatively reliable local regions and validates them across the image. The paper’s path-planning examples should not be relabeled as repeated collision-free trials by a physical robot.[1]
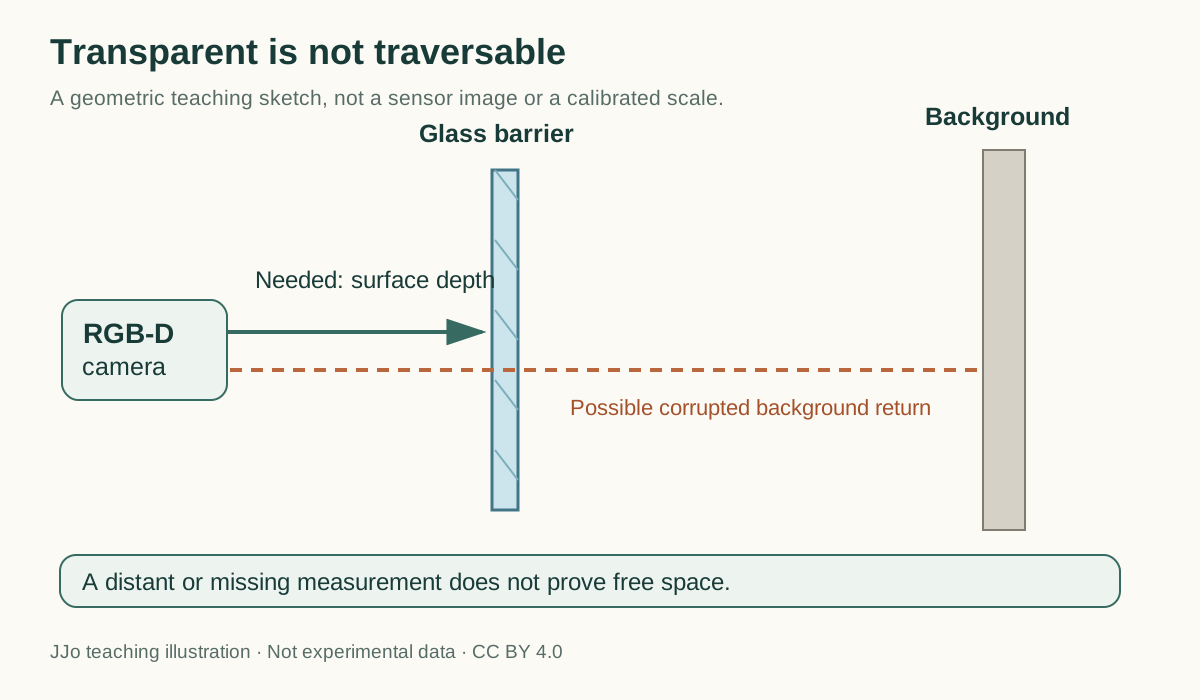
#Reading the first diagram: measured distance is not always obstacle distance
This is an independently created teaching diagram, not an experimental photograph. The camera, glass plane and background wall illustrate why a large depth value does not necessarily mean traversable space. Missing measurements and returns from the background are different sensor failures, but both can remove glass from a map. Original Figure 1 contains actual RGB, sensor-depth, estimated-depth and point-cloud comparisons; those qualitative experimental results can be inspected at the source. Line lengths in this illustration are not measured distances or a calibrated scale.[1][2]
Start here Depth maps, monocular priors and metric scale Open the explanation
A depth map represents distance at image locations as an array. An RGB-D camera provides color and depth, but glass, reflections and occlusion can prevent it from measuring the correct surface. A missing or zero depth value is not the same observation as a distant surface.
A monocular depth prior is a scene-structure estimate produced by a learned model from one color image. Plausible shape does not guarantee an accurate absolute scale in metres. Alignment connects that relative structure to the sensor’s metric measurements. The additional alignment method requires no glass-specific training; this does not mean the depth foundation model itself was never trained.
#1. Why glass is difficult for a depth camera
Transmission and reflection can cause an RGB-D sensor to return background depth instead of glass-surface depth, or to lose the measurement entirely. Glass can fail while the surrounding floor and walls remain well measured. Feeding that point cloud into an occupancy map can make a robot regard a physical barrier as open space. Visual transparency and physical traversability are different properties.[1]
A model operating on color images may infer a glass outline or plane from learned scene regularities. Yet limited visual cues or an incorrect interpretation of the background can also make that prior wrong. Assuming the model is always more truthful than the sensor simply introduces a different source of error. Fusion needs to distinguish each source’s strengths and failure conditions.
A conventional global fit uses depth correspondences across the image to align relative predictions with sensor scale. If corrupted glass measurements participate in that fit, alignment can distort an otherwise useful monocular structural prediction. This study treats the problem as where to generate alignment hypotheses, rather than automatically adding another trained glass-segmentation network.[1]
#2. Generate hypotheses locally and select them globally
First, an RGB image is passed through a foundation model such as Depth Anything 3 (DA3) to obtain relative depth. The image is then divided into patches. Samples within each patch produce candidate scale-and-shift transformations between the prior and sensor measurements. Those candidates are evaluated against the whole image. The result is therefore not a mosaic of independently scaled local depth tiles.[1][3]
What does it mean to preserve shape while changing scale and offset? Expand symbols and the worked calculation
Dprior is the model’s relative depth, s the scale and t the offset. As a teaching example, prior values of 1 and 2 paired with reliable sensor distances of 2 m and 4 m are aligned by s=2 and t=0. These are not measured samples or fitted values from the experiment. If the predicted geometry is already wrong, two parameters cannot create a missing glass plane from nothing. An implementation must also keep depth versus inverse-depth representation and sensor units consistent.
The RANSAC intuition is to form hypotheses from subsets rather than trusting all measurements simultaneously, then evaluate them using more observations. When glass corruption is spatially concentrated, some local samples may avoid it. With enough reliable regions remaining, a useful transformation can survive the full-image comparison. This is a structural condition exploited by the method, not a proof of robustness to an arbitrary proportion of erroneous depth values.
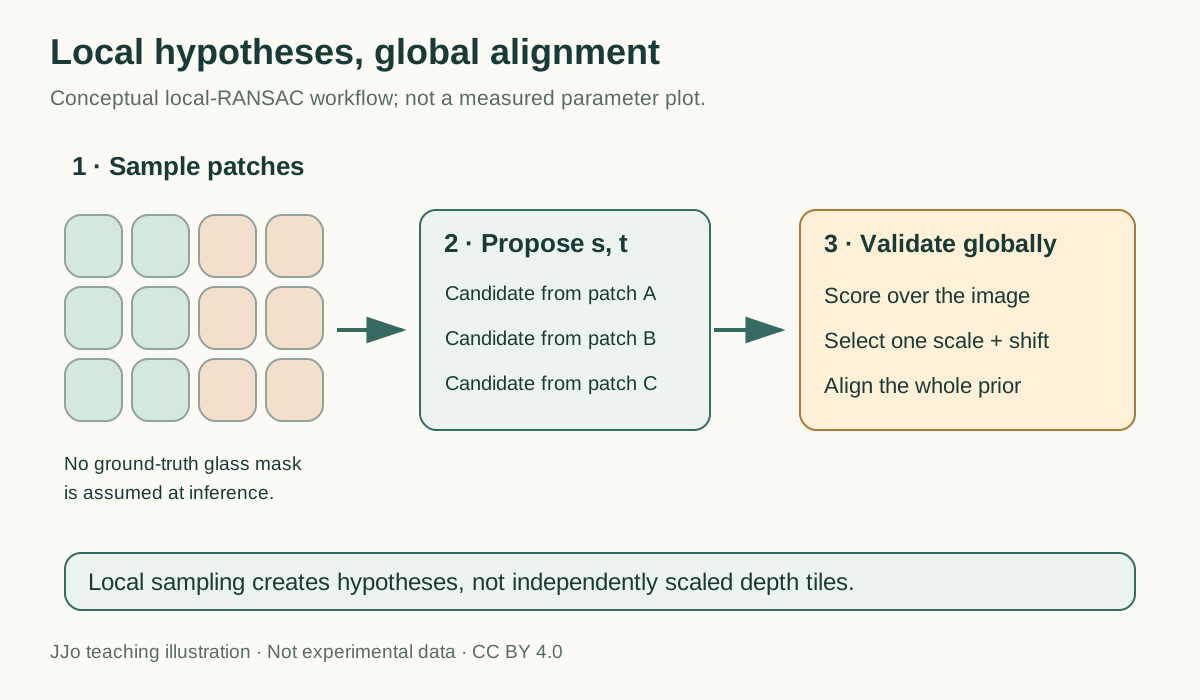
#Reading the second diagram: local hypotheses are not separate final scales
The small grids represent patches used to propose transformations. Reliable wall/floor correspondences and a corrupted glass region are visually distinguished for explanation; the drawing does not imply that inference receives a ground-truth glass mask. It shows candidate s/t pairs evaluated over the full image before one pair is selected. It is not a redraw of the experimental parameter distribution in original Figure 4. Quantitative performance should be read from the paper’s tables and implementation.[1][3]
#3. How the dataset constructs ground-truth glass depth
Dataset construction matters as much as the algorithm. The study combines RGB-D images and camera information from Matterport3D with glass masks from RGB-D GSD. Assuming many indoor glass surfaces are planar, it selects at least three reliable depth points on a surface coplanar with the glass, such as an appropriate window frame. Rays from the calibrated camera are intersected with the fitted plane to fill depth within the glass region.[1][2]
This is not a claim that a perfect independent sensor directly measured every point on the transparent surface. It is geometrically constructed ground truth, depending on selected point depths, camera intrinsics, coplanarity and the planar assumption. Curved glass or a frame offset from the pane would require separate scrutiny. Masks used to construct and evaluate the dataset must also be distinguished from the inference pipeline’s claim not to train an extra glass-specific segmentation network.
Glass regions without usable depth-point annotations are masked out of evaluation. The constructed point clouds are manually inspected, and 917 geometrically consistent images are retained. Consequently, the dataset does not demonstrate successful correction of every excluded difficult region. Selection and annotation conditions define the scope of the reported metrics. Releasing data makes those conditions inspectable; it does not eliminate all uncertainty in the reference depth.[1]
#4. Reading the improvement on 316 difficult images
The paper partitions the dataset into 601 Easy and 316 Hard images using raw-depth AbsRel against the reference depth, with a threshold of 0.03; Hard images exceed that value. Table I evaluates the whole image under the paper’s protocol, not only pixels inside the glass mask. Image counts must not be mixed with performance percentages or presented as a rate of correctly detecting every glass surface.[1]
| Evaluation set | Global AbsRel | Local AbsRel | Global δ<1.25 | Local δ<1.25 |
|---|---|---|---|---|
| All 917 images | 0.152 | 0.095 | 0.855 | 0.937 |
| Easy: 601 images | 0.061 | 0.055 | 0.962 | 0.966 |
| Hard: 316 images | 0.323 | 0.172 | 0.651 | 0.883 |
On Hard images, the relative AbsRel reduction is (0.323−0.172)/0.323, approximately 46.7%. The thresholded accuracy fraction increases by 0.232, or 23.2 percentage points. These describe different metrics. Neither establishes 46.7% fewer robot collisions nor a 23.2-percentage-point increase in physical navigation success. The smaller difference on Easy images, where sensor depth is already better, is also part of the result.
What do relative error and a ratio threshold count? Expand symbols and the worked calculation
zi is valid reference depth, ẑi predicted depth and N the number of valid evaluated samples. For illustration, a reference of 2 m and prediction of 2.4 m give relative error 0.2 and a maximum ratio of 1.2, inside the threshold. A prediction of 2.6 m gives relative error 0.3 and a ratio of 1.3, outside it. These are not actual GlassRecon samples. Invalid/zero depths, depth units and evaluation masks must be defined consistently in an implementation.
#5. What reconstruction and path planning demonstrate
The paper compares different monocular priors and alignment strategies, and shows cases where point clouds and dense reconstruction better retain glass surfaces rather than placing them at the background. It also presents reconstruction on ScanNet++ scenes and campus-collected sequences. These examples connect image-level metrics with potential use as a mapping front end.[1]
However, the word navigation in the title requires checking the experiment. The application constructs an occupancy map from corrected depth and performs A* path planning. The paths in original Figure 9 are computed plans. They are not records of a physical robot repeatedly approaching glass doors without colliding. Planned paths, executed trajectories and safety guarantees are different kinds of evidence.[1]
A real mobile robot also has latency, localization error, tracking error and stopping distance. Better depth does not eliminate those risks. In environments shared with people, conservative obstacle handling and verified stopping behavior are especially important. These are considerations for operational extension, not claims that this paper implements or certifies such a safety system.
#6. Where the approach can fail
The clearest limitation is an incorrect prior. If the monocular model places glass at the background, globally rescaling and shifting that prediction need not recover the correct surface. An affine transformation changes scale and reference level; it is not a separate reconstruction process capable of correcting every structural error. Weak cues and scenes outside the model’s learned distribution can remain difficult.[1]
When glass dominates an image, finding sufficiently reliable patches becomes harder. Large panes, complex reflections, curved glass and sparse trustworthy sensor returns can reduce robustness. The reference dataset’s planar assumption and the inference model’s shape predictions have different failure modes, but both matter. RANSAC does not make performance independent of the outlier fraction or spatial distribution.[1]
Computation must also be considered end to end. Training-free means no additional glass-specific training is required to apply this alignment. DA3 inference still consumes compute and memory, while hypothesis evaluation and map integration take time. Establishing the safe operating rate on particular hardware requires measuring latency from acquisition through planning. That real-time throughput was not independently measured for this explainer.
#7. Why this candidate matters and what to test next
For readers working with RGB-D robot perception, including the focus of this blog, the problem is immediately relevant. The more general engineering lesson is to separate information about structure from information about metric scale. Instead of averaging every source indiscriminately, reliable correspondences can allow a visual prior and physical measurements to compensate for different weaknesses.
The inspected v3 manuscript is dated 23 July 2026, and its comments identify acceptance at IROS 2026. October 2 is this blog’s editorial date, not the paper’s first publication date. A nomination or placement in an award-candidate session mentioned in the supplied selection is not proof of an official final award, so the article does not call it a Best Paper winner. The supplied score of 96 is likewise an editorial assessment.[1]
Further work should measure how often the prior misses glass itself, and evaluate pane size, curvature, illumination, glass dominance, camera type and depth-unit changes. Uncertainty in the ground-truth construction also deserves separate analysis. Physical robot tests would then need repeated path execution, latency measurements, close encounters and verified stopping behavior before supporting operational safety conclusions.
The key contribution is reducing glass-reconstruction error through better alignment of depth priors and sensor measurements, without training another glass-specific detector. Public code and data enable further examination, but this explainer did not rerun the complete benchmark or conduct physical robot tests. Preserving the gap between a promising planning front end and a verified collision-free system is essential to an accurate assessment.[1][2][3]
#Sources and access scope
[1] Zheng, Yu, Chen and Zhang, Enhancing Glass Surface Reconstruction via Depth Prior for Robot Navigation, arXiv:2604.18336v3, 23 July 2026; comments identify IROS 2026 acceptance. Table I and Figures 4 and 9. Paper.
[2] GlassRecon dataset and project information: reference depths, masks and camera intrinsics. Dataset repository.
[3] GlassRecon implementation and guidance for depth alignment and evaluation. Code repository.
Selected for the 2 October 2026 edition and rechecked against the v3 paper, evaluation table, application figures and official repositories on 5 October. No code execution, complete 917-image re-evaluation, physical navigation or collision test was performed here. The inspected arXiv distribution terms and repositories did not establish permission to republish the original figures on this blog. They are therefore linked rather than copied. The two displayed visuals use English labels and are independently created teaching diagrams, not experimental photographs or measured-data plots.