#1. Start with the primary endpoint that was not met
NHS-Galleri reported high specificity and useful cancer-origin predictions for a blood-based multi-cancer test. However, the randomized trial did not meet its primary endpoint of reducing stage III/IV cancer diagnoses in the intervention arm. The Nature Medicine paper published on 22 September 2026 states this upfront and then reports prespecified secondary test-performance endpoints in the intervention arm. These analyses were descriptive, with no hypothesis testing.[1]
Presenting this as “clinical benefit proven in a large trial” combines answers to different questions. Randomizing 142,250 participants is an important strength, but the specificity in the performance table is not the effect of screening on late-stage cancer across the two randomized arms. A good test metric and a screening program that improves health outcomes require different evidence.[1]
#2. What the test detects, and what it does not diagnose
Multi-cancer early detection (MCED) seeks signals from multiple cancers in one blood sample rather than relying exclusively on separate cancer-specific tests. This assay uses cell-free DNA methylation patterns. When it detects a signal, it also predicts a cancer signal origin (CSO), helping direct the subsequent diagnostic pathway. A positive classifier output is nevertheless not itself a confirmed cancer diagnosis. Participants with positive results were referred for further assessment through NHS standard-of-care pathways.[1]
There are three distinct questions. Does the test detect a signal in someone with cancer? Does it avoid unnecessary signals in people without cancer? Once a positive result is associated with a confirmed cancer, does it correctly indicate the origin? Sensitivity, specificity and origin-prediction accuracy use different denominators. Collapsing them into one “accuracy” hides which part of the diagnostic journey works well and which remains difficult.
In an asymptomatic screening population, non-cancer tests greatly outnumber cancer tests. Even a small false-positive proportion can consequently generate a substantial diagnostic workload. Conversely, a large proportion of negative results does not demonstrate that very few cancers were missed. This base-rate problem is why screening reports need both classification metrics and actual follow-up diagnoses.[1][2]
#3. The difference between 142,250 randomized people and the analysis sets
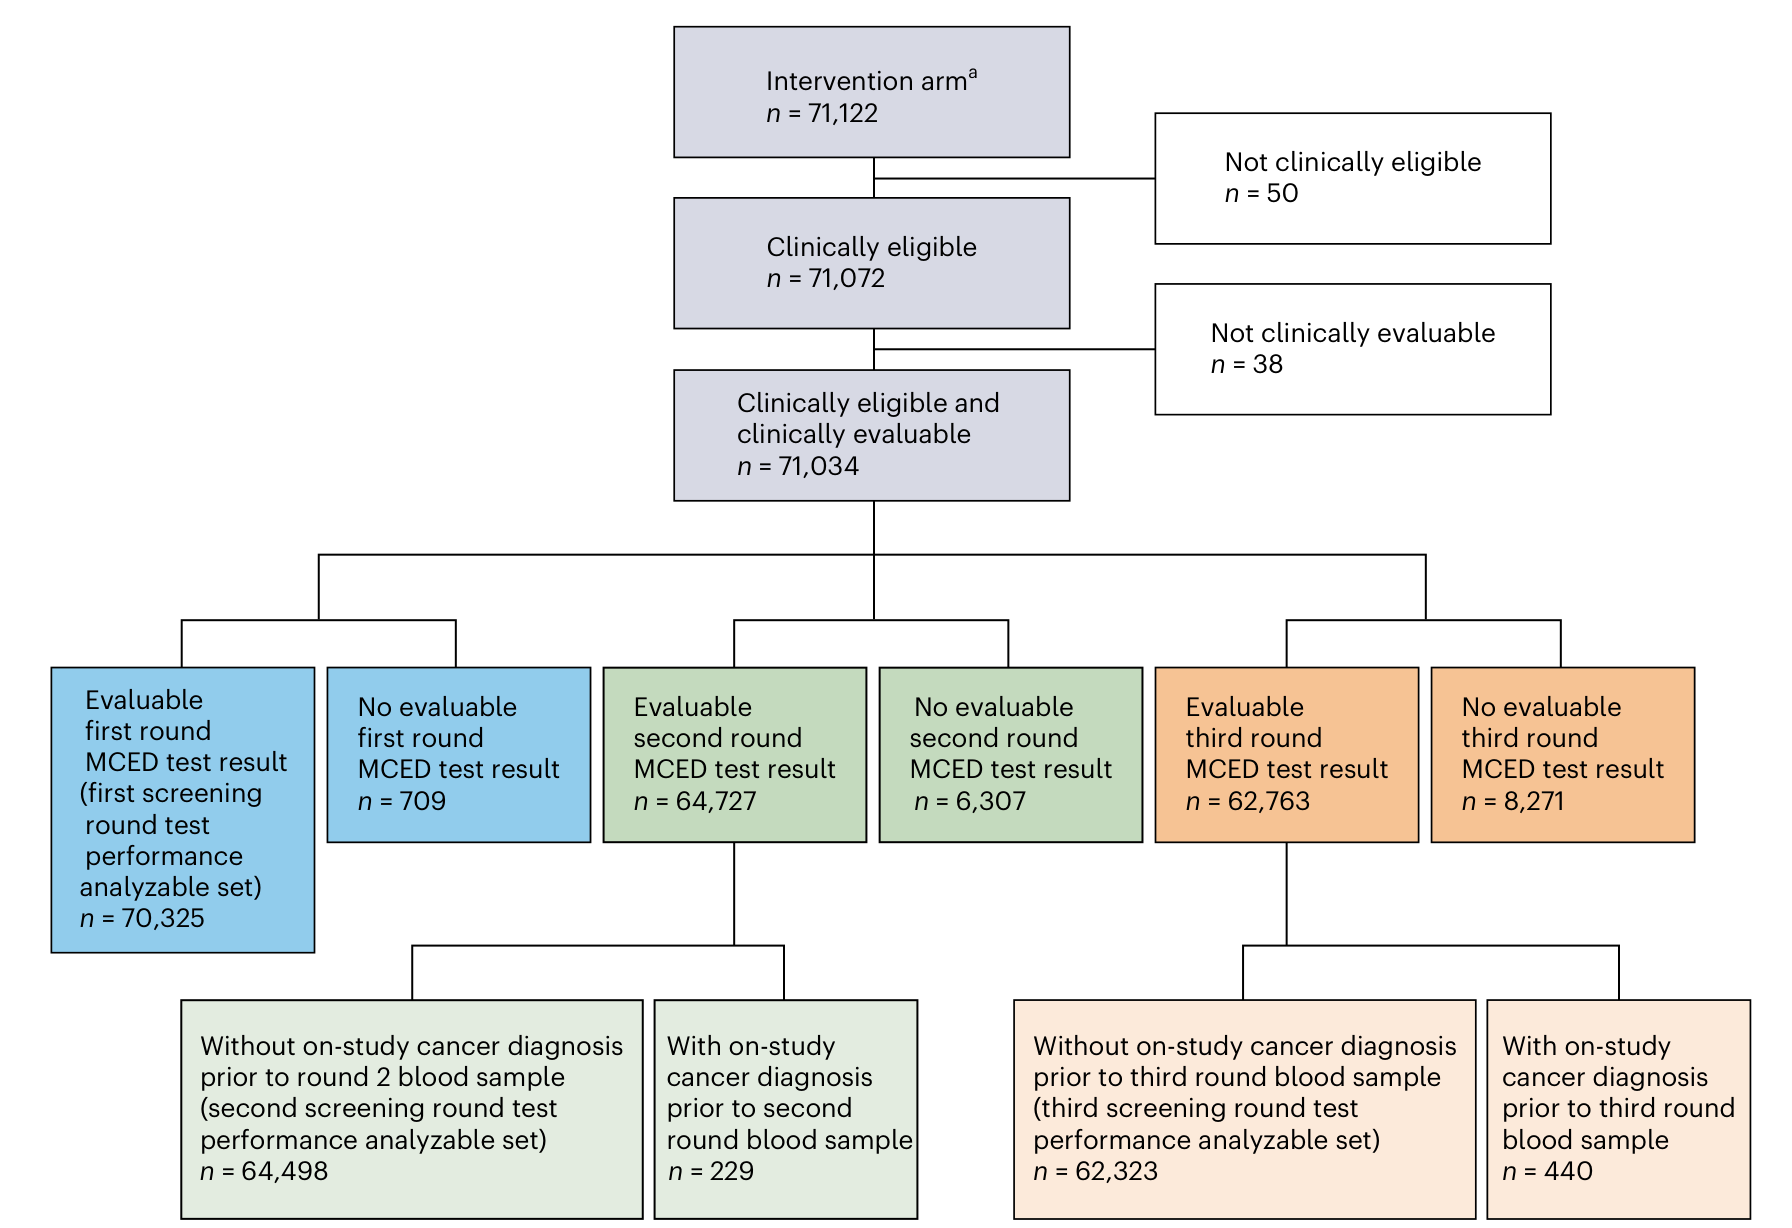
The trial randomized 142,250 participants aged 50–77 years in a 1:1 ratio between intervention and control. The round-specific performance table does not represent all those people being tested at every round. The intervention analysis applied clinical and test-evaluability requirements; later rounds also accounted for on-study cancer diagnoses preceding the relevant blood sample. The resulting denominators differ by round.[1]
The first original figure makes this selection process visible. It moves from the intervention arm through clinically eligible and evaluable participants into each round’s test-performance analysis set. The final counts of 70,325, 64,498 and 62,323 show why “142,250 people each received three tests” is not a valid description of this analysis.[1]
| Measure | First round | Second round | Third round |
|---|---|---|---|
| Evaluable tests in the performance analysis | 70,325 | 64,498 | 62,323 |
| Positive results | 722 | 518 | 561 |
| Newly confirmed primary cancers after positive results | 419 | 261 | 257 |
| Positive predictive value | 58.0% | 50.4% | 45.8% |
| Specificity | 99.56% | 99.60% | 99.50% |
| Twelve-month episode sensitivity for all cancers | 37.2% | 27.1% | 26.7% |
These figures follow the definitions in Table 2. Summing the round-specific denominators gives 197,146 evaluable test episodes, not 197,146 distinct participants. A person can contribute to more than one round. That sum must not be treated as a count of independent people, and aggregate estimates must be interpreted under the paper’s own analysis definitions.[1][2]
#4. Why 99.56% specificity can coexist with a 58% positive predictive value
TP denotes a positive result with cancer confirmed, FP a positive result without cancer under the analysis definition, TN a negative result without cancer, and FN a negative result followed by a cancer diagnosis. These counts depend on the follow-up period and on what qualifies as cancer. Combining this paper’s definition of a new primary cancer with another classification would change the four cells of the table.[1][2]
Specificity is the proportion of non-cancer cases that test negative. Positive predictive value is the proportion of positive results associated with confirmed cancer. First-round PPV is 419/722, approximately 58.0%, whereas specificity is 68,895/69,198, approximately 99.56%. Their denominators—722 and nearly 69,200—are entirely different. The two findings are not contradictory; they are different conditional proportions derived from the same analysis.[1]
As a numerical illustration, applying a 0.44% false-positive rate to 10,000 non-cancer tests gives approximately 44 positives. This is a rescaling to explain the proportion, not an additional observed cohort. To determine the cancer fraction among all positive results, the cancer frequency and sensitivity must also be known. This is one reason a test’s PPV can differ between patients already suspected of having cancer and a general screening population.
In the second expression, π represents the cancer frequency within the relevant population and time window, under the simplifying assumption that all metrics use the same reference definitions. Combining sensitivity from an unrelated study with specificity from this trial would not by itself predict real-world service performance. A change in population can change the base rate, the mix of cancer types and the distribution of stages.
#5. What negative results and sensitivity still require us to examine
Twelve-month episode sensitivity for all cancers was 37.2% in the first round and 27.1% and 26.7% in subsequent rounds. In the prespecified subgroup of 12 cancer types, the corresponding estimates were higher: 63.4%, 47.6% and 50.7%. The selected 12-type results must not be relabeled as sensitivity for all cancers. The distribution of detectable biological signals varies with cancer type and stage.[1][2]
The same caution applies to a high negative predictive value. When most screened people do not have cancer, the non-cancer fraction among negative results can naturally be high. Thus, “NPV is about 99%, so the test rules out almost every cancer” ignores sensitivity and the base rate. Readers need the follow-up window and the fact that cancers diagnosed after a negative test contribute to the episode-level definition.
Lower PPV and sensitivity in later rounds are important observations, but they do not establish that the assay technically deteriorates over time. The first round can include previously undetected prevalent disease, and later rounds differ in their participants and cancer composition. Explaining the change requires analysis of those definitions and population transitions. One average score conceals these differences.[1][2]
#6. The 91.1–93.6% range includes either of two origin predictions
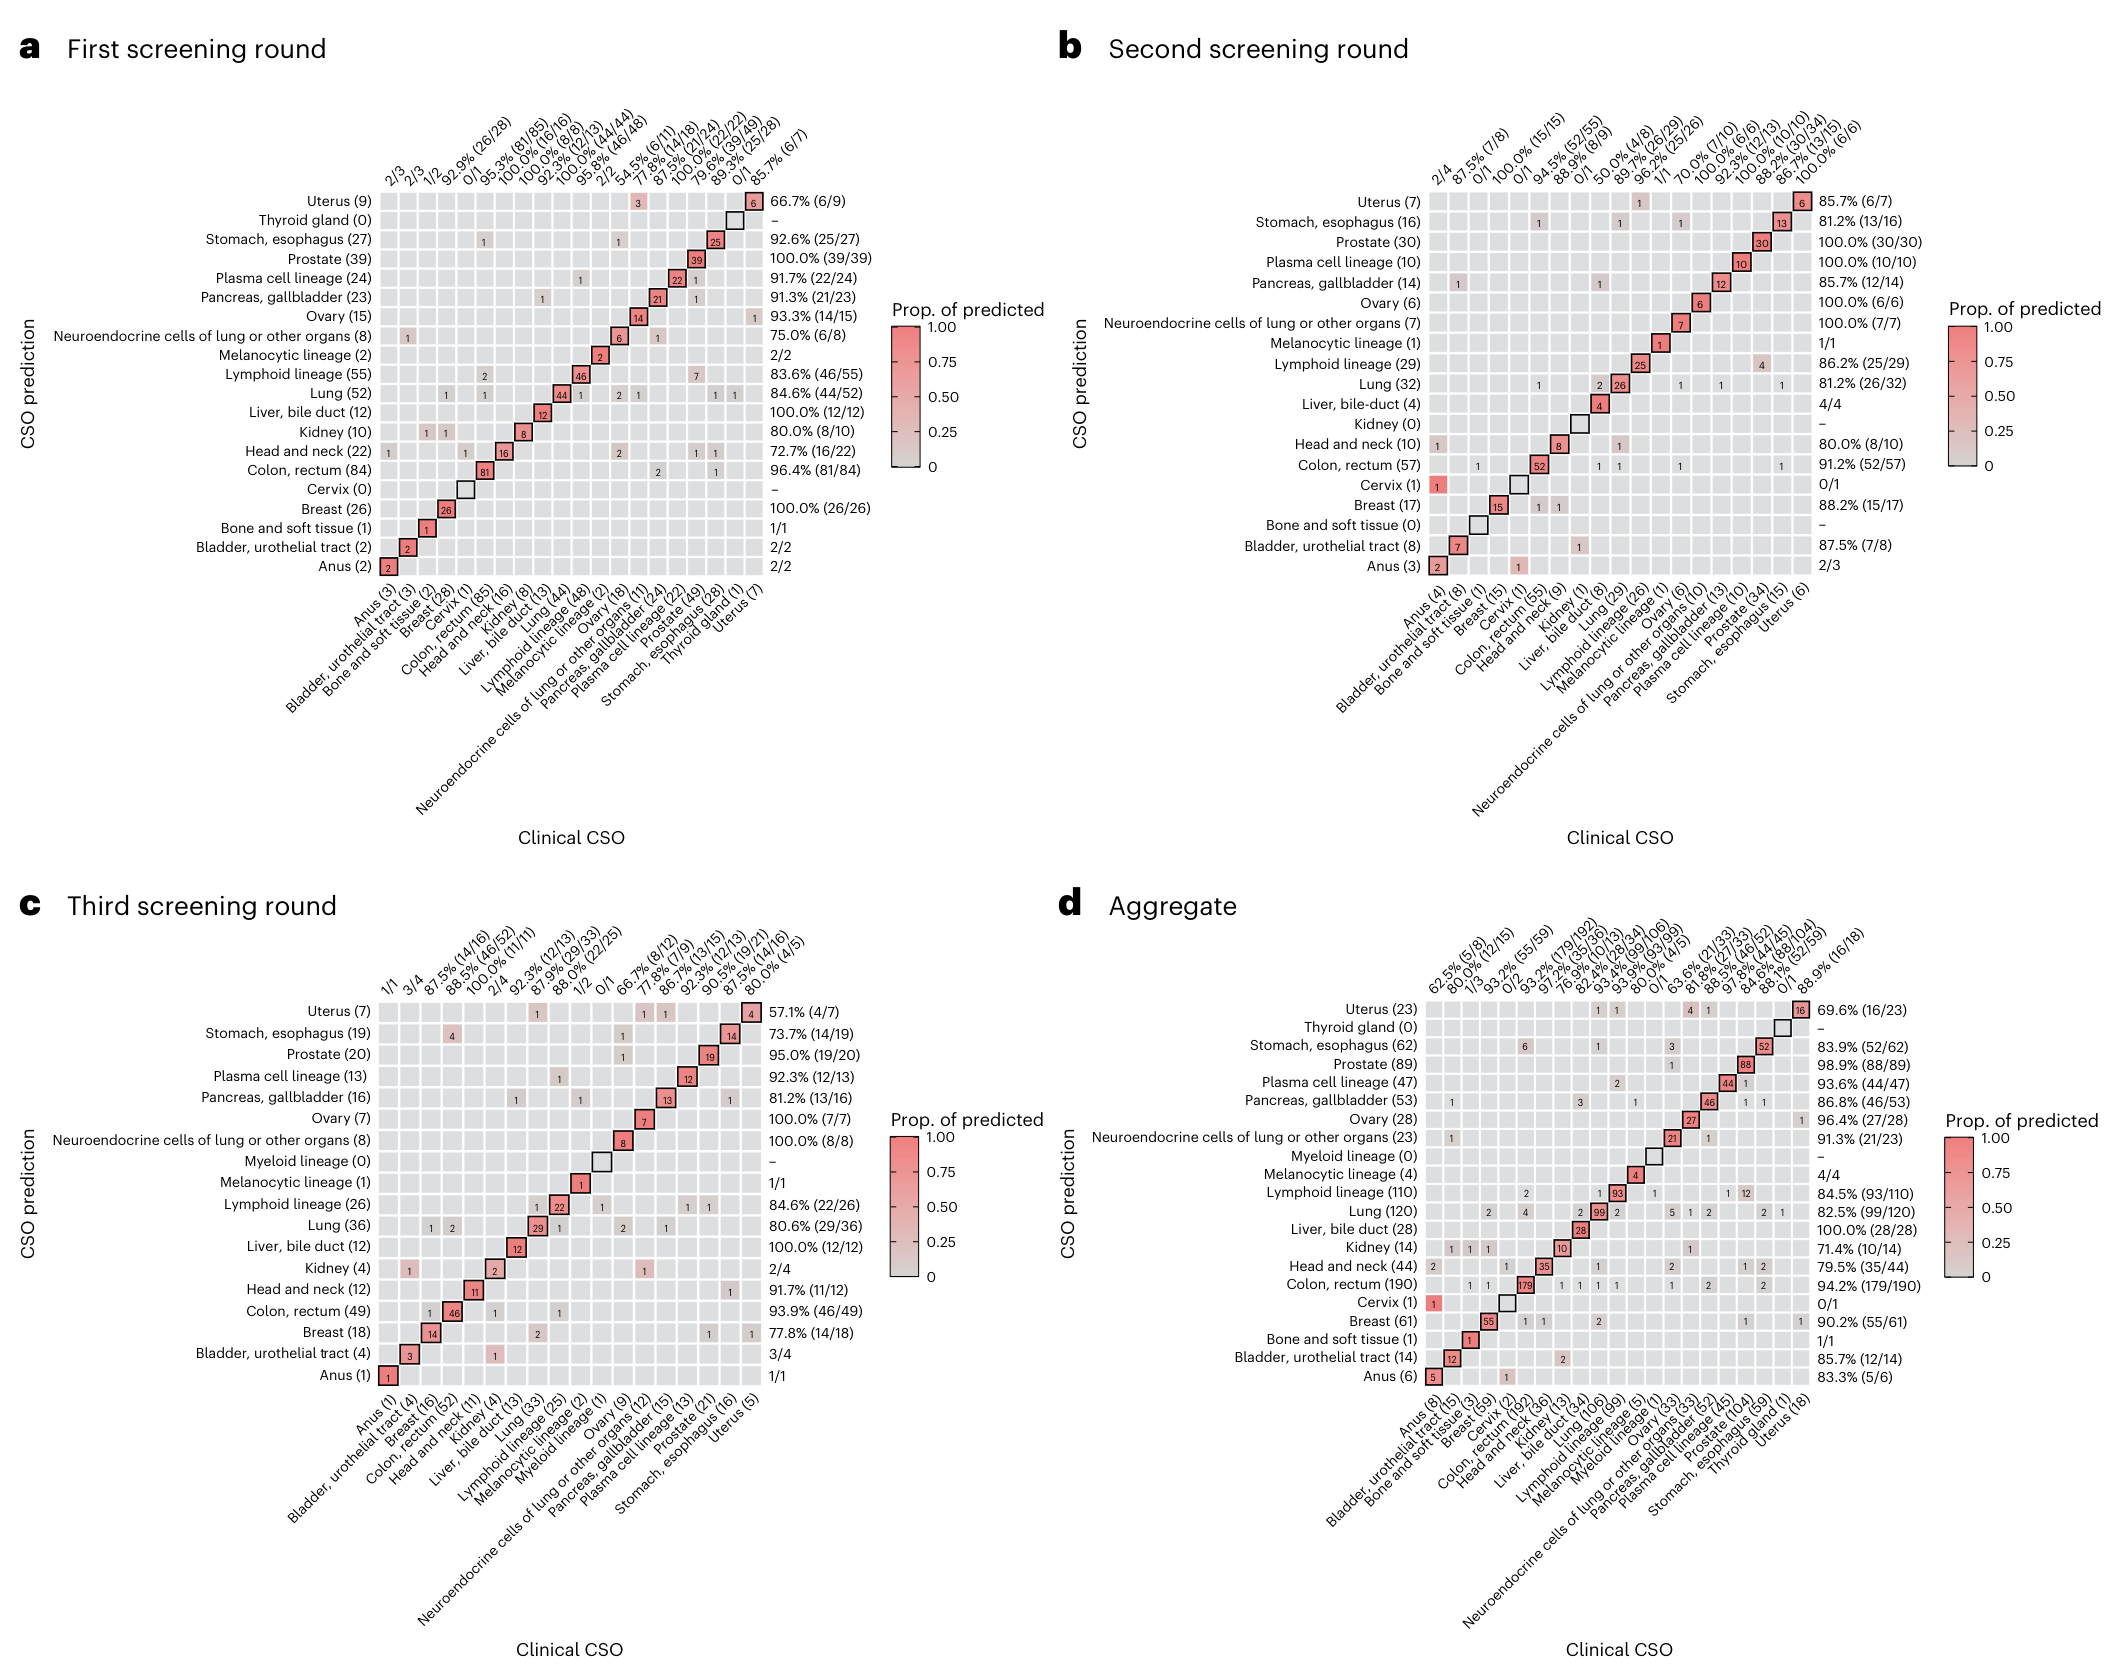
After detecting a cancer signal, clinicians still need to decide where to investigate. CSO prediction helps guide that process. The reported round-specific 93.6%, 92.3% and 91.1% figures mean that the first or second predicted origin was correct among true-positive participants with diagnosed cancer. They are neither first-choice-only accuracy nor cancer-detection accuracy across everyone screened.[1]
The aggregate accuracy of the first CSO prediction alone is separately reported as 87.0% (815/937). Directing workup to one location and identifying the correct location somewhere within two candidates can have different practical consequences. A second candidate can add useful information, while the procedures needed to investigate it create a separate question about burden. Origin prediction is therefore not a complete surrogate for the utility of screening.[1]
The second original figure compares predicted origin with clinically assigned origin using confusion matrices. Diagonal cells indicate agreement and off-diagonal cells disagreement. Round-specific and aggregate panels contain different case mixes, and percentages for uncommon cancers can move markedly when a few cases change. A strong-looking diagonal does not establish uniform performance across all cancer types. The visualization should also not be conflated with the headline statistic that allows either of the first two predictions to count as correct.[1]
#7. The gap between classification performance and patient benefit
An earlier cancer signal does not automatically establish that an actionable treatment window was advanced, or that late-stage cancer or mortality was reduced. Diagnosing a disease sooner can increase measured survival time from diagnosis without changing the time of death. The biological behavior of detected cancers also matters. These are general principles for interpreting screening studies; this explainer does not estimate the size of each bias in NHS-Galleri.
Randomized comparisons are important precisely because they help address such problems. This performance paper mainly describes intervention-arm results and subsequent diagnostic findings. Its secondary descriptive analyses do not include hypothesis testing, and the original stage III/IV primary endpoint was not met. Selecting high specificity or favorable cancer-type results cannot reverse that primary finding into a success claim.[1]
The opposite claim—that the entire study is therefore worthless—is also unjustified. Observed positivity rates, links to confirmed diagnoses, origin predictions and round-specific performance in a large repeated-screening program can inform future trials and diagnostic pathways. A useful interpretation can simultaneously recognize an unmet clinical hypothesis and valuable performance data.
#8. Interests, context and generalizability
GRAIL funded the study and participated in design, data curation, interpretation and manuscript preparation. The paper also discloses employment and equity-related interests for several authors, alongside descriptions of independent analysis and verification. Such disclosures are not a substitute for assessing the evidence; they are relevant to evaluating independent replication, data access and adherence to the analysis plan.[1]
The recruitment ages, NHS diagnostic pathways, retention between rounds and follow-up system are part of the setting in which the results were obtained. Deploying the same assay elsewhere can produce different program outcomes if access to care, cancer distribution or diagnostic delays differ. Assuming identical laboratory classification does not establish identical reductions in late-stage disease in another health system.
This paper does not establish that the assay should replace standard screening. A negative result does not automatically remove the need to assess symptoms or determine eligibility for existing screening programs. This is a research explainer, not an individual recommendation to purchase or reject a particular test. Decisions about a paid screening service should not be reduced to a single accuracy figure while ignoring follow-up care and demonstrated clinical benefit.[1][2]
#9. The next result to look for is not just a higher score
Further evaluation needs randomized clinical outcomes, including late-stage disease and mortality where appropriate, sufficient follow-up, variation by cancer type, and the burden of additional investigations. Time and procedures between a positive result and diagnosis, interventions following false-positive results, and cancers after negative results all matter. The target population and screening interval may be as consequential as the classifier itself.
For a new analysis, begin with the denominator, follow-up window, primary-versus-secondary status and whether the endpoint was prespecified. An announcement of a 0.1-percentage-point gain in specificity is not interchangeable with an announcement that late-stage cancers decreased. The former concerns erroneous positive results among non-cancer cases; the latter concerns a disease outcome of the screening program.
The central lesson is that good test-performance metrics do not guarantee clinical utility. High specificity and conditional origin accuracy should be reported accurately, alongside the unmet primary endpoint and sensitivity for all cancers. Keeping those findings together avoids both exaggerated optimism and an uninformative blanket dismissal.[1][2]
#Sources and access scope
[1] Neal et al., Performance of a multi-cancer early detection test in the randomized controlled NHS-Galleri trial, Nature Medicine, published 22 September 2026, DOI 10.1038/s41591-026-04652-8. Original source.
[2] Supplementary Information to the same paper: subgroup performance, additional analyses and Supplementary Table 15 definitions of screening metrics. Original source.
Checked on 25 September 2026 against the 22 September Nature Medicine article, its Table 2, Figures 1 and 3, and supplementary endpoint definitions. The statement that the primary endpoint was not met is explicitly reported in this paper’s abstract and Trial endpoints section; it is not an independent reanalysis of the separate primary-outcome report. No individual-level trial reanalysis or personal screening assessment was performed. Original figures are attributed under CC BY 4.0.