Start with the practical answer. Leukemia cells within one patient need not share one state. While sensitive populations decline during treatment, other cells may persist or change state. This study identifies cell populations inferred to be chemoresistant from paired diagnostic and relapse single-cell data, then adds their signals to genetic risk and measurable residual disease (MRD) after induction therapy. It improves retrospective risk discrimination; it is not a prospective trial showing better survival after treatment assignment by the new classifier.[1]
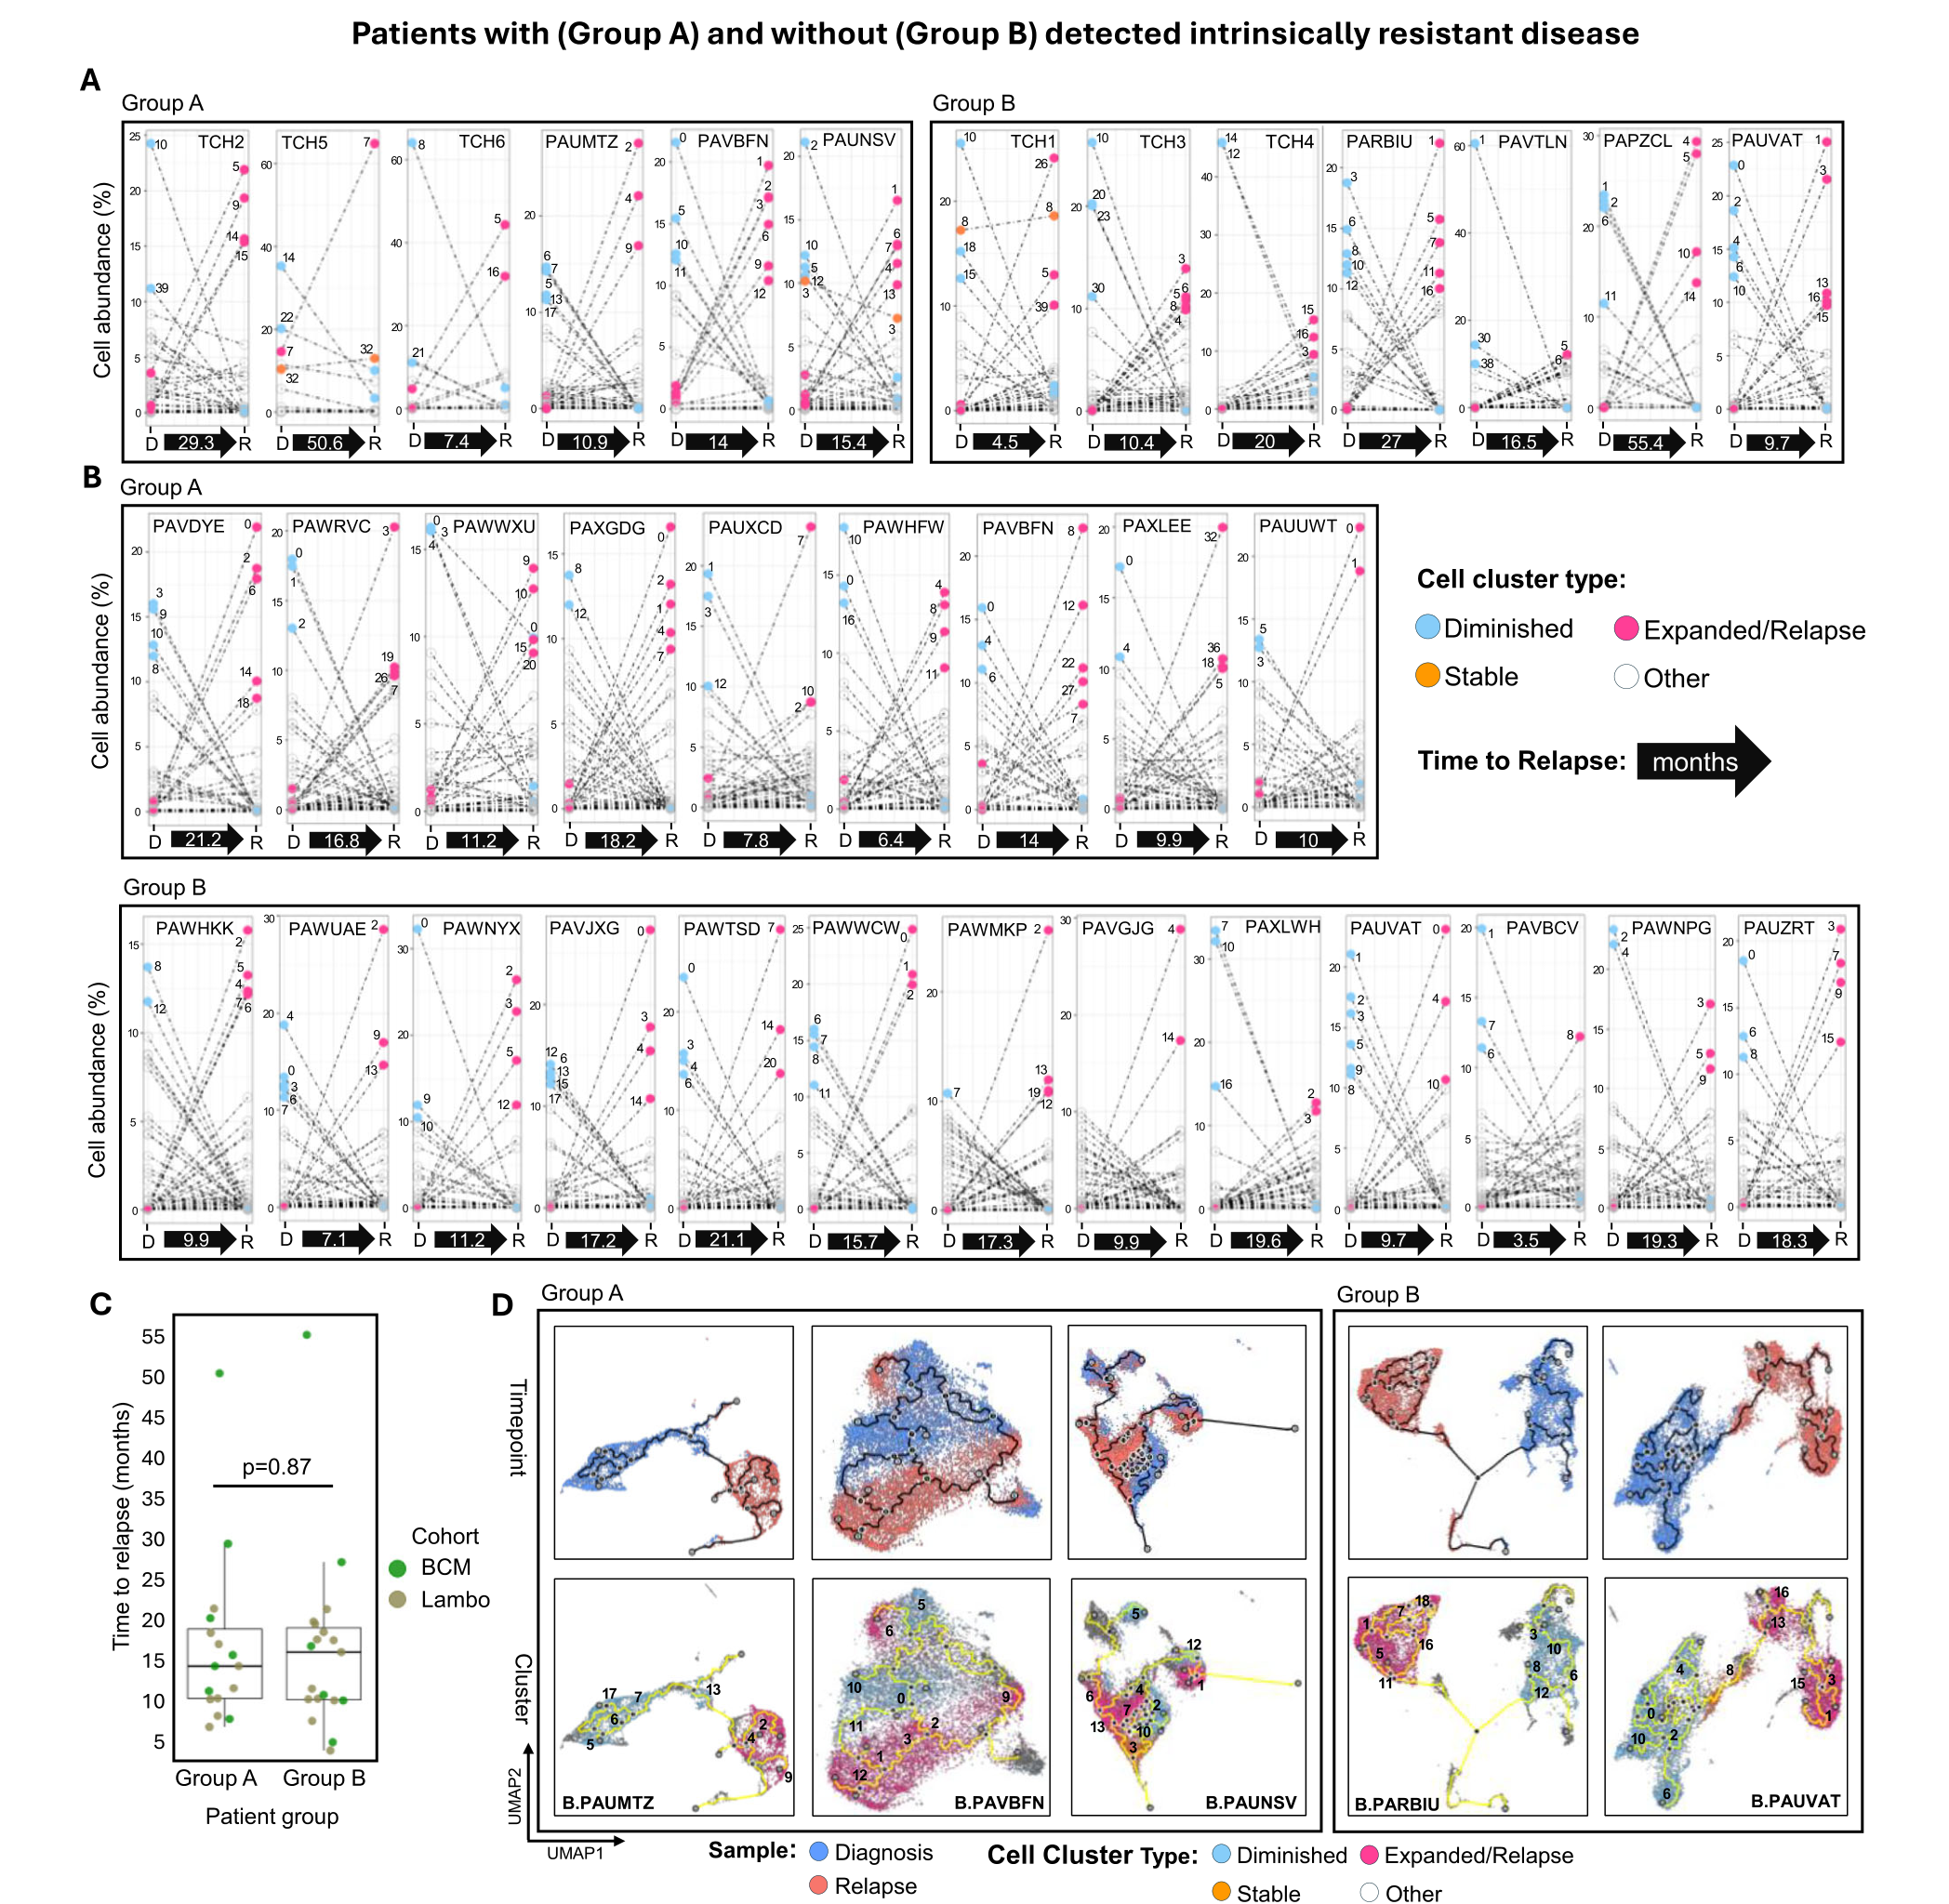
#Reading original Figure 2: the lines describe population changes
The small plots in A and B compare estimated population abundance at diagnosis, D, and relapse, R, for individual patients. Pink denotes expanded/relapse populations, blue diminished populations and orange stable populations. A dashed line is not a filmed trajectory of an individual cell. Panel C shows no significant difference in time to relapse between the two classified groups. Panel D uses trajectory analysis to infer relationships between transcriptomic states. Colored RNA-based populations should not automatically be treated as independently identified DNA clones.[1]
Start here AML, single-cell profiling, MRD and transplantation Open the explanation
Pediatric acute myeloid leukemia, or pAML, is a myeloid blood cancer in children. This is a research explanation, not an individual diagnostic or treatment recommendation. Single-cell RNA sequencing measures which genes are expressed in individual cells. It is not a complete measurement of their DNA alterations. Cells with similar RNA patterns can be grouped for analysis.
MRD measures residual disease after treatment using a sensitive assay. The MRD information combined in this study is post-induction chemotherapy, not information available from the diagnostic sample alone. Describing the complete prediction as a single blood test on the day of diagnosis would change the chronology. SCT, stem-cell transplantation, is a treatment with potential benefits and substantial burdens. A high prediction score cannot by itself determine whether a child should undergo transplantation.[1]
#1. An average expression profile can hide a rare population
An average RNA profile combines signals from many cells. The dominant population can dilute the characteristics of a smaller one. Single-cell analysis can separate such signals, but cells may be undersampled and transcripts can go undetected. “Not detected” and “never present” are consequently different conclusions. Failure to observe a rare population at diagnosis cannot alone establish that every resistant cell arose after therapy.
The authors analyze paired diagnosis–relapse data from 33 patients. The 13 patients represented in the BCM cohort and the 22 in the earlier Lambo cohort include two reprofiled individuals, so they are not 35 independent people. Patient-specific differences were large, and remeasurement also revealed technical variation. This motivated a patient-by-patient paired strategy. A large cell count is not the same as a large patient count or number of independent replicates.[1]
The discovery set necessarily includes patients with available relapse samples. The frequency of a population within this selected set cannot be substituted for its prevalence in all newly diagnosed pAML. Validation in further clinical cohorts is important precisely because discovery in a selected longitudinal dataset and predicting outcomes in broader populations are distinct tasks.
#2. Separate resistance observations from model-based inference
The paper classifies diagnostic cell populations as expanded, stable or diminished according to their change in abundance by relapse, and separately identifies populations detected only at relapse. A diagnostic population that becomes more abundant is interpreted as an intrinsically resistant candidate. Transcriptomic trajectories from diminished populations toward relapse populations are interpreted as evidence consistent with acquired resistance. This is an inference model based on state and time, not direct observation of every cell’s treatment history.[1][2]
Intrinsically resistant populations were inferred in 14 of the 33 patients, while evidence of acquired resistance under the model was identified in 19. One patient belonged to both categories; resistance-associated populations were inferred in 32 patients overall. The first two counts cannot be added as disjoint categories. Membership of Group B also does not establish that intrinsically resistant cells below the detection limit were absent.[1]
The inferred intrinsically resistant diagnostic populations averaged approximately 5–6% of pAML cells in the relevant samples. This is not an exact shared fraction for every patient. Similar states need not imply the same lineage, and post-treatment convergence or alternative origins may violate the model’s assumptions. The authors disclose these limitations and subsequently evaluate candidate populations through outcome prediction and experiments.[1]
#3. What the discovery and outcome-analysis cohorts contribute
The paper also reports that applying existing stemness or pathway gene signatures was insufficient to predict outcomes for most patients. It tests whether signals from particular candidate resistant populations can discriminate outcomes in other patients’ profiles. The intention is to use cellular heterogeneity, rather than explain all patients with one universal resistance gene.[1]
Figure 3 labels 829 patients in the AAML1031 analysis and 263 in the combined AML08 and AAML0531 validation analysis. These are the analysis populations used in that figure—not the total enrollment of every original clinical trial, nor necessarily newly recruited individuals wholly separate from all discovery participants. The study is a retrospective analysis of clinical data, accounting for differing risk and transplantation-allocation criteria across trials.[1]
| Stage | What the study does | What it does not establish |
|---|---|---|
| Discovery | Paired diagnostic and relapse single-cell analysis in 33 patients | Population prevalence across all new diagnoses |
| Prognosis | Adds candidate resistant-cell information to genetic risk and MRD | A new test itself improves treatment outcomes |
| Preclinical response | Analyzes patient-derived cells, PDX models and drug responses | The same clinical efficacy and safety in people |
| Treatment decisions | Proposes potential use of the revised stratification | Prospective transplantation assignment by this classifier |
Consistency across cohorts and data types is stronger than one favorable training result. Nevertheless, successful retrospective analysis and prospective operation are different achievements. Practical use needs reproducible sample processing, measurement quality and failure rates, turnaround time and decision rules. Good discrimination in an external population does not automatically yield well-calibrated probabilities for individual patients.
#4. Five-year EFS below 40% does not mean mortality above 60%
The study identifies a high-risk subgroup with abundant candidate resistant populations among patients not allocated transplantation under existing criteria. The abstract summarizes a subgroup comprising approximately 20% of non-SCT patients, with five-year event-free survival below 40%, accounting for nearly half of deaths in that population. The Results section reports five-year EFS of 38% in AAML1031 and 27% in AML08 plus AAML0531 for the LR2-high category. Those definitions and denominators should be retained, not generalized to an identical prognosis for 20% of all pediatric AML.[1]
Event-free survival and overall survival are different endpoints. EFS concerns time without an event defined by the study; OS concerns survival itself. Experiencing an event does not necessarily mean dying at that time. Thus, 38% EFS cannot be translated into “62% died.” The second reproduced figure, Figure 3, has OS on its vertical axis. The EFS figures above come from the text and separate supplementary outcome analyses.[1][2]
Is a survival curve just the final number of patients divided by the starting number? Expand symbols and the worked calculation
This general expression explains the Kaplan–Meier estimator. At each event time, nᵢ is the population at risk immediately beforehand and dᵢ the number of events. In a hypothetical example without censoring, two events among ten people followed by one event among the remaining eight give (1−2/10)×(1−1/8)=0.70. Clinical datasets include censoring when follow-up ends or is lost, changing the denominator at successive times. This example does not recalculate the paper’s EFS. Changing what counts as an event also changes the distinction between OS and EFS.
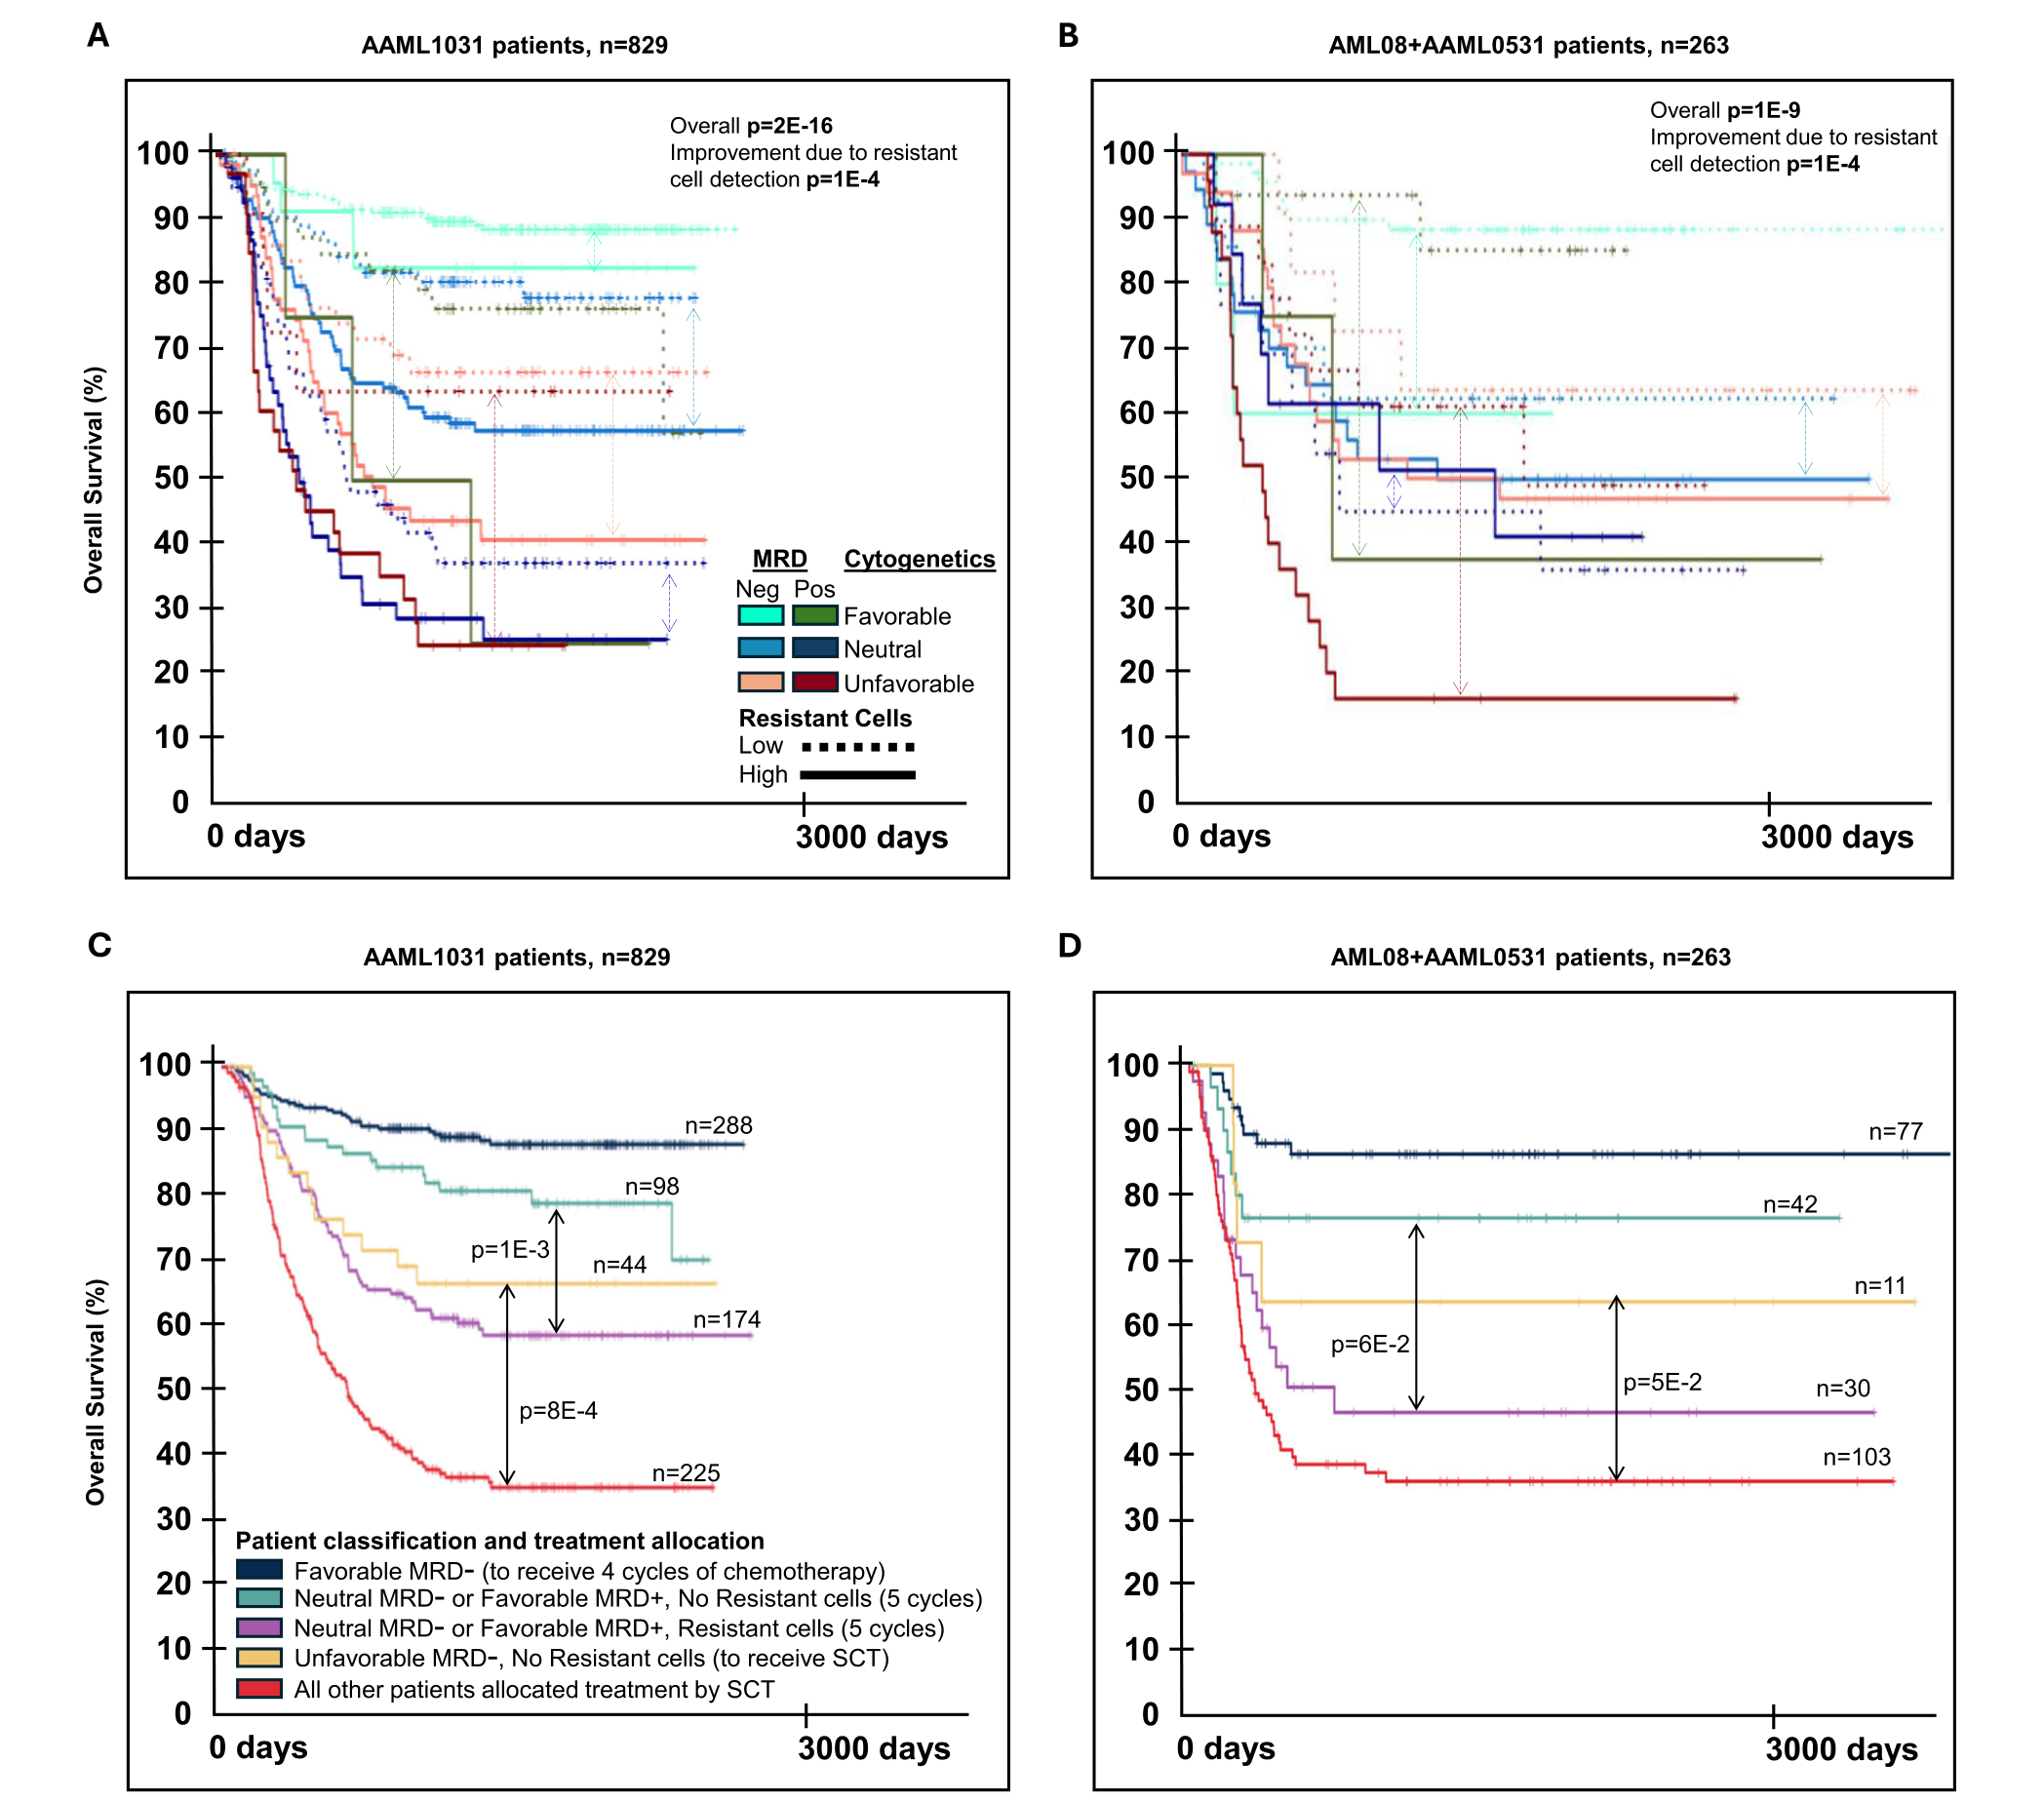
#Reading original Figure 3: risk stratification is not a treatment-effect comparison
Panels A and B compare OS by genetic risk, MRD and candidate resistant-population abundance. Panels C and D show reclassification in relation to existing allocation rules. The colored groups have different sample sizes, and some displayed comparisons in the validation cohort have p values above 0.05. The figure therefore cannot be summarized as significant separation between every curve. Differences between transplanted and nontransplanted groups are also not randomized estimates of transplant benefit: baseline risk and treatment selection are related.[1]
#5. How far are predicted drug vulnerabilities directly validated?
The authors use patient-derived xenografts, or PDXs, and cell experiments to investigate chemotherapy responses and molecular vulnerabilities. A PDX studies patient-derived cancer cells in an animal model. It does not reproduce every human immune, tissue or exposure condition. It provides a preclinical link for testing disease mechanisms, not an efficacy trial in patients.[1]
A central limitation is that a transcriptional-state change is not the same as cell death. A declining signature after a drug may reflect a temporary state transition rather than elimination of the cells. The authors acknowledge that some analyses do not directly establish reduced viability, and add viability evidence in PDX validation involving RARA-, FLT3- and CDK4/6-related targets. The support from those experiments must remain distinct from clinical validation of every proposed target.[1]
A vulnerable-looking population is not proof that administering the corresponding drug to people improves long-term outcomes. Exposure, safety, interactions with other cells and combination-treatment context require additional evaluation. This explainer does not recommend a drug or provide instructions to replace a patient’s current treatment.
#6. Limits and publicly described reproduction resources
The resistance model makes assumptions about the origin of relapse populations. It does not fully address new post-treatment origins or convergent RNA states arising from different lineages. Some molecular subtypes are underrepresented in the discovery cohort. Performance needs evaluation in further subtypes and sample-processing conditions.[1][2]
Nor was this a prospective trial assigning transplantation or targeted treatment through the new classifier and demonstrating improved outcomes. Good survival in a small retrospectively treated subgroup cannot remove treatment-selection bias or differences in original risk. Prospective validation of prognosis and prospective validation of the utility of changing treatment are themselves separate steps.
The paper points to transcriptomic data at GEO accession GSE271137, Source Data, supplementary files and an analysis-code repository. The authors declare no competing interests. This update checked the publisher article, relevant supplementary material and the availability statements, but did not download individual-level profiles to retrain the risk model or make patient-specific assessments.[1]
#7. The next milestone is not just a better prediction score
Clinically, the next question is whether the risk grouping reproduces when newly diagnosed patients are followed prospectively, and which decisions gain useful information beyond existing genetic risk and MRD. Results also need consistency across laboratories and sequencing batches. Samples without a detected resistant population should not automatically be interpreted as low risk when measurement failure or detection limits could explain the absence.
The further question is whether acting on the information benefits patients. Better prediction offers an opportunity for a better decision; it does not itself create an effective treatment. The risk of unnecessarily recommending intensive therapy must be weighed against missing an important treatment opportunity. Individual care requires assessment by the pediatric hematology–oncology team.
The candidate’s contribution is to connect rare diagnostic cell states with later MRD to expose gaps in existing stratification. It neither predicts every relapse with certainty at diagnosis nor claims that all resistance was present from the start. The supplied editorial score of 96 is not a clinical-recommendation grade. Independent prospective validation and demonstrated patient benefit are more consequential next steps than a more attractive classification plot.
#Sources and verification scope
[1] NajafPanah et al., Characterization of chemoresistant cell populations improves risk stratification and therapy prediction in pediatric acute myeloid leukemia, Nature Communications, 2 October 2026, DOI 10.1038/s41467-026-78283-5. Accepted peer-reviewed early version; Results, Discussion, Methods, Data/Code availability and Figures 2 and 3 checked on 5 October 2026. Publisher article.
[2] Supplementary Information to the same paper, including the population-progression model and supplementary outcome, EFS and sensitivity analyses. Supplement.
This explainer follows the supplied candidate selection while separating resistance inference, prognostic validation and preclinical treatment response. The early version may be replaced by the edited record. The 33-patient discovery stage is distinguished from later outcome analyses, and EFS is not relabeled as OS. No raw-data reanalysis, experimental replication or patient treatment assignment was performed. Original figures retain all panels, axes, annotations and colors, with attribution under CC BY-NC-ND 4.0. This article does not display advertising.