BUY LESS, CHOOSE BETTER
mAh is only the beginning. Read Wh, W and g together.
Stored energy, available power and the weight you carry every day. Match all three to find the right pack for you, not simply the most expensive one.
Principles first, products last. This is a source-based buying guide, not a report of our own product testing.
A power bank is an energy store, a voltage-converting power supply and a small system that protects components as they heat up. “Large capacity,” “fast” and “fast for a long time” are therefore different assessments. Read this guide as observation → engineering explanation → illustration → buying implication. Product candidates and Coupang/Danawa searches come after all the explanations.
The underlying product and price research is dated 25 September 2026; this principles-first revision is dated 26 September. Original illustrations are conceptual. Actual component photographs have an identified source and examined sample. Calculations are not presented as product measurements.
#1. Why does a 20,000mAh pack not charge another 20,000mAh?
The voltage differs first. Losses are a separate issue. mAh measures charge; Wh measures energy. The same mAh rating can represent different amounts of stored energy depending on its reference voltage. Read the reference voltage and Wh together on the label.[1]
A 20,000mAh rating at 3.7V means 20Ah × 3.7V = 74Wh. Delivering that energy at 5V with zero loss still gives only 74Wh ÷ 5V = 14.8Ah, or 14,800mAh. Do not classify the entire decrease in the charge number as heat. The reference voltage has changed.
Loss-free conversion example. 14,800mAh refers to 5V; 20,000mAh refers to 3.7V. Original explanatory diagram · not measured data
Series and parallel arrangements follow the same accounting. Four 3.6V, 5Ah cells in a 2S2P configuration make a 7.2V, 10Ah pack: 72Wh. Expressed at the individual-cell voltage, that is 3.6V × 20Ah = 72Wh. Multiplying the cell-equivalent 20Ah by the pack voltage of 7.2V double-counts the energy.
Buying implication: Compare the label’s nominal energy in Wh before its large mAh headline. A difference between cell-referenced capacity and rated USB output capacity is not, by itself, evidence of fraud. Match voltage, current and test conditions first.
#2. Why are usable watt-hours smaller still?
Now consider actual energy losses. Internal cell losses, the conversion circuit and wiring turn some energy into heat. Protection circuitry also restricts operation to a voltage range that avoids over-discharge. Energy retained in the cell but inaccessible at cutoff is not the same as energy dissipated as heat.[2][3]
For illustration, assume that 96% of a nominal 74Wh is accessible and that average conversion efficiency to USB is 90%. Then 74 × 0.96 × 0.90 = 63.94Wh. Distinguish the retained 2.96Wh from approximately 7.10Wh lost during conversion. These percentages are neither standard guarantees nor measurements of the products below.
Illustrative assumptions: 96% accessible energy and 90% average conversion efficiency. Retained energy is not heat loss. Original explanatory diagram · not measured data
Even if 63.94Wh leaves the USB port, not all of it is stored in the phone battery. The cable, the phone’s power-management IC (PMIC) and charging process introduce further losses. Energy consumed by the display, games or communication during charging does not remain as increased battery charge either. Power-bank output Wh and Wh stored in the phone are different metrics.
Measure usable energy by integrating port voltage multiplied by current over time. In the following expression, integrating time in hours gives Wh. An integral using seconds must be divided by 3,600.
Try the energy calculation
Enter the reference voltage on the label. Both percentage inputs are illustrative assumptions, not product measurements.
Buying implication: Do not stop at “95% efficiency.” Identify the measurement boundary. A chip’s peak efficiency, the whole pack’s usable-energy ratio over a discharge and end-to-end efficiency into the phone are different quantities. Without an independent USB Wh measurement, the actual value remains UNKNOWN.
#3. Why is a DC/DC circuit needed, and what does the coil do?
A battery supplies direct current, but its voltage is not constant. Cell voltage changes with charge state while a USB device requests a negotiated voltage such as 5V, 9V, 15V or 20V. Connecting wires alone cannot continuously create that requested voltage; a DC/DC converter is required.[2]
A boost converter uses an inductor and a rapidly controlled MOSFET switch. During the on interval, inductor current increases and magnetic energy accumulates. During the off interval, the inductor’s voltage, associated with maintaining current, works with the input source to transfer energy toward the output. An output capacitor bridges intervals and reduces ripple. This is not a device that creates energy; it changes the relationship between voltage and current.[4]
Conceptual boost operation, not a product schematic. Real units may use synchronous rectification and buck–boost stages. Original explanatory diagram · not measured data
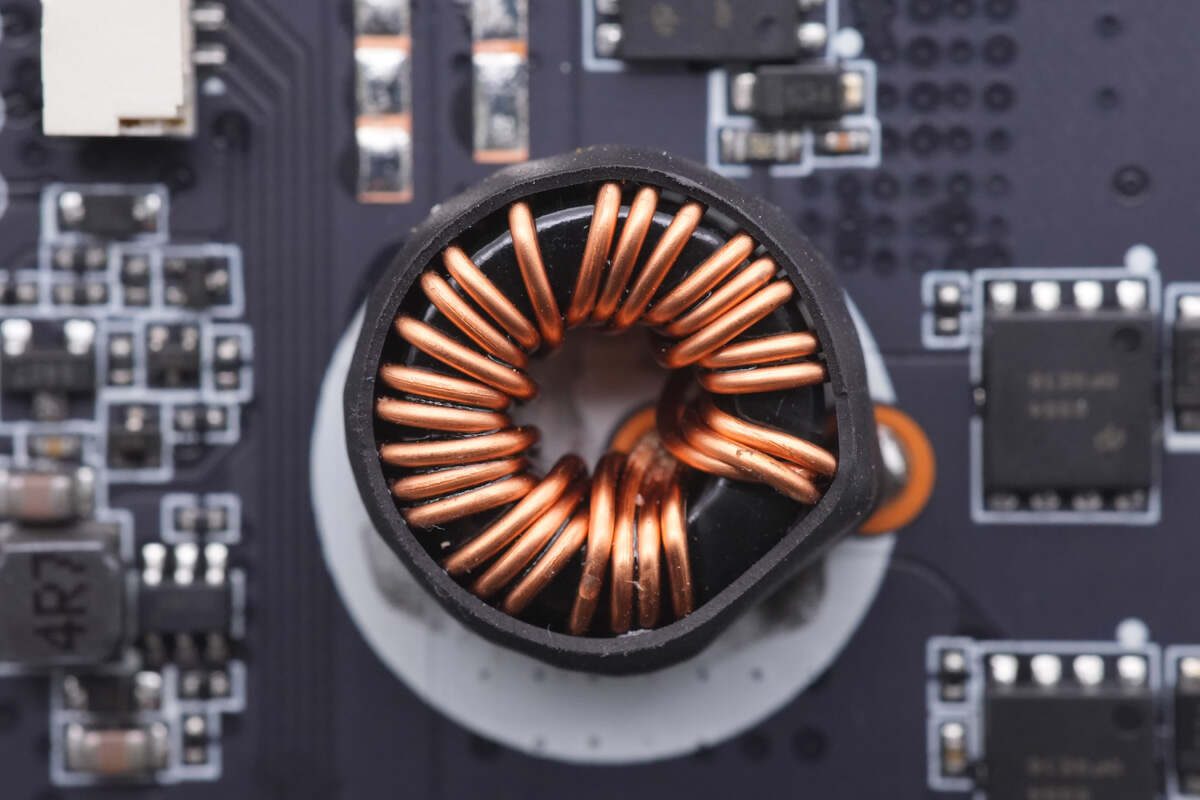
Photo: ChargerLAB, PB200P teardown, 2023-10-11 · view source
These photographs show the examined sample, not a guarantee for other models or current production. Open the source if external images are blocked. Do not dismantle your own battery.
The copper winding in the photograph makes that mechanism tangible. Wire and magnetic material are not ideal: they introduce resistive and magnetic losses, while MOSFETs introduce conduction and switching losses. Managing heat becomes important when substantial power passes through small components. If a series-connected pack’s voltage exceeds the target output, a buck stage is needed; a buck–boost stage can handle both relationships.[2][4]
Buying implication: Prefer efficiency and temperature measurements at the voltage and power you need over a generic “premium chip” claim. The photograph shows a particular sample dismantled in 2023, not a universal circuit. Reading a published teardown is different from dismantling a battery yourself. Do not dismantle your own pack.[5]
#4. Why might a 100W pack charge a device at only 25W?
USB-C describes the connector; USB Power Delivery (USB-PD) provides a power-negotiation framework. The source advertises supported operating conditions and the receiving device requests an appropriate one. The cable’s permitted current and the device’s temperature and charge state also constrain operation. 100W does not mean that 100W is forcibly pushed into every device.[2][6]
Advertised power is a ceiling. Shared profiles, the cable, device state and port allocation constrain actual power. Original explanatory diagram · not measured data
Programmable Power Supply (PPS) allows voltage and current adjustment within supported ranges. Two sources both marked “PPS” do not necessarily enable every Galaxy device’s fastest charging mode. Check the specific port’s PPS range, the device and the cable. Connecting a second device can redistribute the total power budget, so single-port maximum and simultaneous outputs are separate specifications.[6]
One reason to raise voltage is to transmit the same power with less current. At an unchanged resistance R, cable resistive loss scales with the square of current.
For an illustrative 15W transfer at 5V/3A versus 15V/1A through a 0.1Ω cable, cable losses are 0.9W and 0.1W respectively. This calculation covers the cable only. It does not mean the entire charging system becomes nine times more efficient. The device must support the voltage, and conversion itself also has losses.
Buying implication: Check device requirements → single-port profiles → cable → simultaneous port allocation, rather than selecting by the combined wattage printed on the front.
#5. Why does charging slow near the end?
Constant-current/constant-voltage (CC–CV) control explains a familiar lithium-ion charging pattern. During CC, the cell charging current is maintained while cell voltage rises. After the voltage setpoint is reached, CV holds that voltage while current progressively decreases. This finishes charging without exceeding the cell-voltage ceiling.[7]
Normalized conceptual curves, not measurements. Voltage and current have different units; transition is not fixed to a particular state of charge. Original explanatory diagram · not measured data
Consequently, a “100W maximum input” pack does not receive 100W throughout its entire 0–100% recharge. Also, constant current at the cell does not mean constant USB input power: voltage and conversion operation change. Do not fix the CC-to-CV transition to an indicated 80% for every product. Settings, cell condition and temperature affect the curve.
Buying implication: Separate peak input wattage from measured times to 50%, 80% and 100%. Topping up before a short trip and recharging overnight place different demands on the pack.
#6. Why is peak output not sustained output?
A converter delivering 100W at 90% efficiency needs approximately 111.1W input, producing about 11.1W of conversion loss. At 95% efficiency, the loss falls to about 5.3W. Five percentage points can therefore represent a meaningful thermal difference inside a small enclosure. The following calculation follows the definition of efficiency; it is not a product-temperature test.
Simplified thermal path. Surface temperature is not the internal hotspot temperature. Original explanatory diagram · not measured data
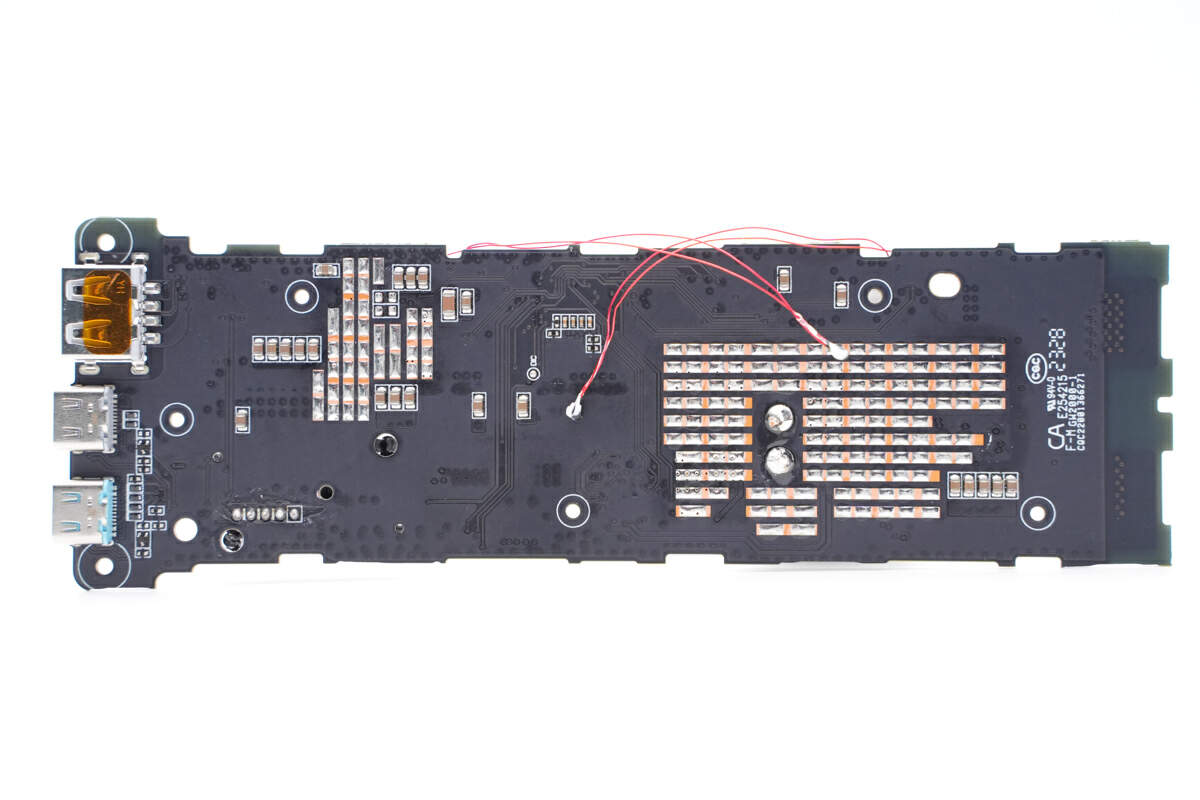
Photo: ChargerLAB, PB200P teardown, 2023-10-11 · view source
These photographs show the examined sample, not a guarantee for other models or current production. Open the source if external images are blocked. Do not dismantle your own battery.
Heat travels from components through PCB copper, thermal interfaces, heat-spreading structures and the enclosure into surrounding air. If heat removal cannot keep up, temperature rises and a controller may reduce or stop output. That is why peak and sustained output differ. An enclosure that conducts heat effectively can also feel warmer; a cooler-feeling surface does not prove the internal cells are cooler.[2][5]
A closer engineering look: the rate of heat accumulation
In a single-temperature thermal RC model, a larger thermal capacitance Cth slows temperature rise for the same loss, while a larger thermal resistance Rθ makes heat escape less easily. This educational approximation omits temperature differences between locations in the actual product.
Low state of charge also matters. As internal voltage falls, supplying the same output power can require more input-side current, increasing resistive heating and voltage sag. Reaching the cell undervoltage cutoff sooner under a heavy load can reduce usable Wh. This is why a successful peak-wattage snapshot immediately after charging is insufficient evidence.[2][3]
Buying implication: Under matched ambient temperature and load, inspect output and temperature at 5, 15 and 30 minutes, low-charge output and Wh delivered through termination. Those times are observation points, not universal throttling times.
#7. Why is protection circuitry not wasting capacity?
A battery management system (BMS) may encompass protection, measurement and state-of-charge estimation. Actual products can distribute these functions across several ICs. Voltage, current and temperature measurements inform control of power-path MOSFETs to reduce risks such as overcharge, over-discharge and overcurrent. Balancing support for series-connected cells also varies by design.[3]
Example protection architecture. Sensor count, balancing and thresholds differ by product. Original explanatory diagram · not measured data

Photo: ChargerLAB, PB200P teardown, 2023-10-11 · view source
These photographs show the examined sample, not a guarantee for other models or current production. Open the source if external images are blocked. Do not dismantle your own battery.
The small probes in the photograph illustrate temperature-sensing components such as NTC thermistors. Having a sensor does not make heat disappear. Sensor placement, control settings, disconnect switches and actual heat-removal paths must work together. A marketing count such as “ten protections” does not specify the implemented thresholds or manufacturing quality.[3][5]
Stopping discharge at a protection limit safeguards the cell rather than deceiving the reader about usable Wh. Conversely, protection circuitry does not eliminate manufacturing defects or every form of damage. Stop using a pack with damage, swelling, unusual odor or abnormal heating and follow manufacturer guidance. Do not compress it back into shape or bypass protection to extract more energy.
Buying implication: Do not create safety grades from price or the number of advertised protections. Check the exact model, certification information, importer, warranty and recalled serial ranges. A historical brand recall does not implicate every model; failing to find a recall is not proof that none exists.
#8. Why can wireless charging produce more heat?
Wired charging transfers power through conductors. Wireless charging uses coupling between a transmitter’s time-varying magnetic field and a receiving coil. The transmitter converts DC into an alternating signal; the receiver rectifies the received power back into DC. Extra circuitry and both coils can introduce losses.[8]
Each additional stage can introduce loss. Better alignment neither eliminates loss nor guarantees a fixed efficiency. Original explanatory diagram · not measured data
Misalignment or a greater gap changes the coupling conditions. Qi2 magnetic alignment helps reduce positional uncertainty, but it does not create 100% efficiency. The Qi2 name also does not give every product the same power rating. Distinguish 15W products from compatible 25W products and devices.[8]
Avoid a fixed statement such as “wireless always loses 25%.” A useful comparison matches the phone, initial charge, case, ambient temperature and measurement boundary. Wireless transmitter power and power actually stored in the phone battery are different quantities.
Buying implication: Wireless can be worthwhile for cable-free convenience. To maximize energy delivered from one charged pack, consider wired charging first, while checking measurements for the actual device combination.
#9. Why is bigger capacity not automatically better?
At the same 74Wh, a 350g pack represents 21.1Wh/100g, while a 500g pack represents 14.8Wh/100g. That number describes energy relative to mass only. Additional mass may come from heat spreading, a stronger enclosure, ports or circuitry, trading portability for other capabilities. Lower weight alone proves neither better quality nor greater safety.
Arithmetic example assuming 74Wh for both packs. These are not measurements of particular products. Original explanatory diagram · not measured data
“Cylindrical” and “pouch” primarily describe form factor, while “LFP” and “NMC” describe chemistry. The cylindrical label does not establish one universal cycle life or energy density. Product weight includes protection electronics, casing, thermal structures and cables as well as cells. Be cautious when cell-level Wh/kg is presented as a finished product’s performance.
Knowing usable energy and device power gives a rough runtime estimate. Assume a measured 60Wh is available at USB and the device receives an average 30W: the estimate is about two hours. Changing consumption, downstream losses and termination conditions prevent treating that as a guaranteed runtime. Higher output wattage does not increase stored watt-hours.
Buying implication: Set the daily energy requirement and acceptable weight first. An emergency phone top-up and continuous laptop operation are different use cases. Capacity you will actually carry matters more than the maximum you might someday need.
#10. Before products: recognize a useful test and purchase conditions
A useful capacity test discloses starting charge, ambient temperature, load, port and termination rule. Do not treat a 15W result and a 100W result as an unconditional head-to-head comparison. Conversion efficiency and protective behavior depend on operating point. Measure Wh at USB and examine the full power and temperature record together.
Record load and ambient temperature; integrate Wh at the USB port. 5, 15 and 30 minutes are observation points, not universal cutoffs. Original explanatory diagram · not measured data
Practical sequence: Label Wh → device’s single-port requirement → PPS and cable → simultaneous outputs → full-discharge usable Wh and temperature → weight → warranty and recalls → checkout total. Keep missing measurements UNKNOWN rather than filling them with advertised maxima.
For air travel, check the label’s Wh but do not conclude that “under 100Wh means universally permitted.” IATA gives guidance on carrying power banks in the cabin and preventing short circuits. Recheck the capacity, quantity, storage and use rules applicable to your airline and route at departure. Historical research in this guide is not authorization to board with a particular pack.[9]
Should built-in cables be avoided?
A built-in cable adds convenience but also a wear point from bending or retraction. For long ownership, check whether a separate USB-C port remains usable if that cable is damaged. A built-in cable is not guaranteed to fail; actual durability tests and warranty terms matter.
Does a higher price mean greater safety?
Price is not a safety certificate. Cells, protection electronics, thermal design, manufacturing quality and a traceable supply chain matter. Limited data is not itself proof of a defect either. This guide does not invent unsupported safety scores or a universal winner for every user.
#11. Sources and how to read the illustrations
The ten original diagrams explain mechanisms. CC–CV curves and efficiency/weight calculations are explicitly marked not measured data. Three external teardown photographs sit next to explanations of those components; the 2023 ChargerLAB sample is not generalized to all current production. TI device documentation provides examples of implementation, not a claim that the recommended packs contain those particular TI chips.
The original research’s approximate 94.5Wh estimate for Anker A110A is not retained. The manufacturer’s 99.75Wh specification corrects it and appears in the product card. Each card links its product specification source and credits its photo provider. Prices are historical references dated 25 September 2026, not current offers.[10]
[1] Anker, Why is the Rated Capacity of Power Banks Lower Than Expected?.
[2] Texas Instruments, BQ25798 buck–boost charger: operating features and thermal regulation.
[3] Texas Instruments, BQ76952 battery monitor/protector: voltage, current, temperature and balancing.
[4] Texas Instruments, Topology Tutorial: What is a Boost?, 8 July 2016.
[5] ChargerLAB, PB200P teardown: inductor, PCB heat path and temperature probes, 11 October 2023. Photographs remain the property of their provider.
[6] Texas Instruments, TPS25772-Q1: USB-PD/PPS and power management implementation example.
[7] LG Energy Solution, Battery Glossary — CC/CV Charging, 23 November 2022.
[8] Wireless Power Consortium, Qi wireless charging and Qi2.
[9] IATA, Passenger baggage rules. Check the airline’s current conditions as well.
[10] Anker, Prime A110A: 26,250mAh, 99.75Wh, 300W total.
#12. With the principles clear, choose products by use case
For phone top-ups, start with a lightweight daily pack; for a laptop, start with the required port output and sustained performance. Wireless and built-in cables primarily buy convenience, not additional energy. These are eight main candidates and the additional P23 comparison from the earlier research, not a ranking based on uniform independent testing or freshly verified sellers.
Prices are reference snapshots from the 25 September 2026 research, not freshly verified offers or inventory. Compare by use case rather than rank. Photographs load from external sources and remain the property of their providers.
Showing 9 candidates
Samsung
EB-P3400
10,000 mAh · 25 W · 210 g
Why this use case
For phone top-ups, prioritize portability rather than carrying the extra mass of a 20K pack.
Important limits
Not for Galaxy 45W or high-power laptops. Measured usable USB Wh was not established.
Historical reference: ₩34,000–38,000 · 2026-09-25
Product specification source

Samsung
EB-P4520
20,000 mAh · 45 W · 402 g
Why this use case
A travel candidate for Galaxy users, combining 45W PPS/SFC 2.0 support with three USB-C ports.
Important limits
45W is not guaranteed simultaneously on every port. Check sustained-temperature and usable-Wh tests separately.
Historical reference: ₩33,990 · 2026-09-25
Product specification source
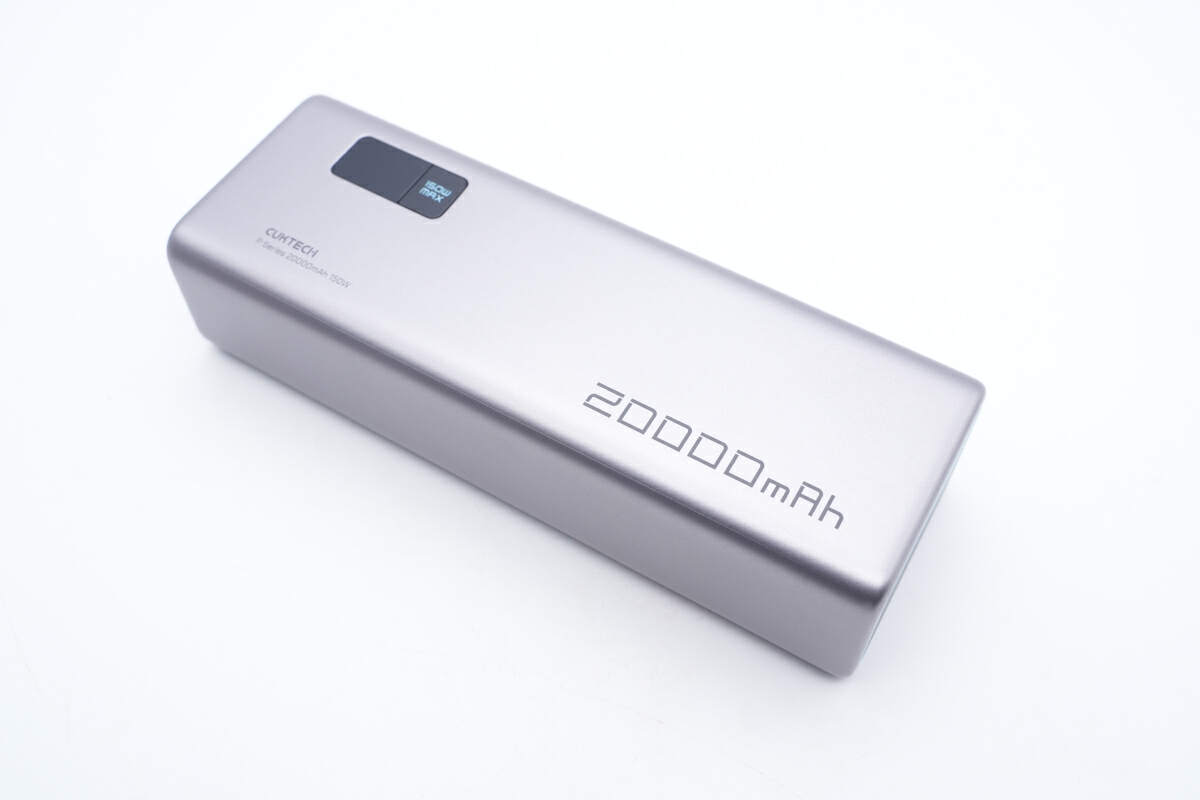
CUKTECH 15
PB200P
20,000 mAh · USB-PD 100 W · 452 g
Why this use case
A phone-and-laptop candidate with published teardown evidence for cells, protection circuitry and temperature sensing.
Important limits
Separate 150W combined output from 100W single-port USB-PD. A teardown does not establish 100W endurance to empty or guarantee current production.
Historical reference: ₩72,900 · 2026-09-25
Product specification source

Anker Nano
A1638
10,000 mAh · 45 W · 230 g
Why this use case
A 10K option for built-in-cable convenience, reducing the need to pack a separate cable.
Important limits
The cable adds a wear point. Independently measured usable Wh and long-term durability were not established.
Historical reference: ₩57,900 · 2026-09-25
Product specification source

Anker Laptop
A1695
25,000 mAh · 90 Wh · 100 W / 165 W total · 595 g
Why this use case
A candidate for multi-device travel and built-in-cable convenience. Weigh its 90Wh energy against its carry weight.
Important limits
165W is combined output. Do not assume a 100W port sustains that output until empty.
Historical reference: ₩94,900 · 2026-09-25
Product specification source

ARTMU
LB320
25,000 mAh · 90 Wh · 140 W / 145 W total · 495 g
Why this use case
A Korean-market candidate to compare when a 140W-class USB-C port is required.
Important limits
Price per advertised watt does not establish cooling or safety. Independently measured usable Wh was not established.
Historical reference: ₩77,700 · 2026-09-25
Product specification source

Anker Prime
A110A
26,250 mAh · 99.75 Wh · 140 W / 300 W total · 600 g
Why this use case
For several high-power devices and fast recharging of the pack. The manufacturer specifies 300W combined output and up to 250W dual-port input.
Important limits
These are not independent endurance tests by this guide. A 99.75Wh label alone does not guarantee acceptance on a particular flight.
Historical reference: ₩189,900 · 2026-09-25
Product specification source
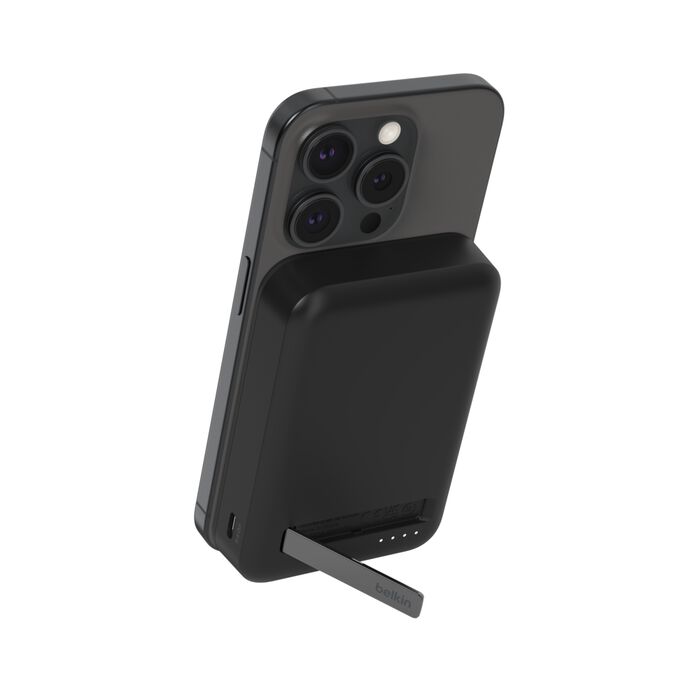
Belkin
BPD008
10,000 mAh · Qi2 15 W
Why this use case
A candidate when cable-free convenience matters more than maximizing usable energy.
Important limits
This model is specified at Qi2 15W. Do not read every Qi2 product as 25W or assume wired-equivalent efficiency.
Historical reference: — · 2026-09-25
Product specification source
CUKTECH 20
P23
25,000 mAh · 140 W / 210 W total
Why this use case
An additional candidate for laptops that can actually use more than 100W input.
Important limits
Higher wattage adds less value if the device needs only 65W. Verify revision, weight and usable Wh against listings and test evidence.
Historical reference: ₩139,000 · 2026-09-25
Product specification source
All shopping buttons open search results only. There are no affiliate tracking codes, cart actions or checkout links. Distinguish revisions, used stock, imports, sellers, warranties and shipping charges. Missing evidence is neither a safety failure nor a safety guarantee.