Begin with the practical idea. Instead of writing a name in the corner of an image file, this research places a detectable indication of origin inside an AI-generated biological representation. However, it concerns two different things. A sequence watermark is embedded in an amino-acid sequence that could be synthesized into a protein. A structure watermark is embedded in the digital three-dimensional coordinates predicted by AlphaFold 3. The researchers report that the first approach preserved the laboratory binding function of selected proteins, while the second did not substantially reduce structural prediction accuracy. They have not built a universal test that recognizes every protein designed by any AI system.[1]
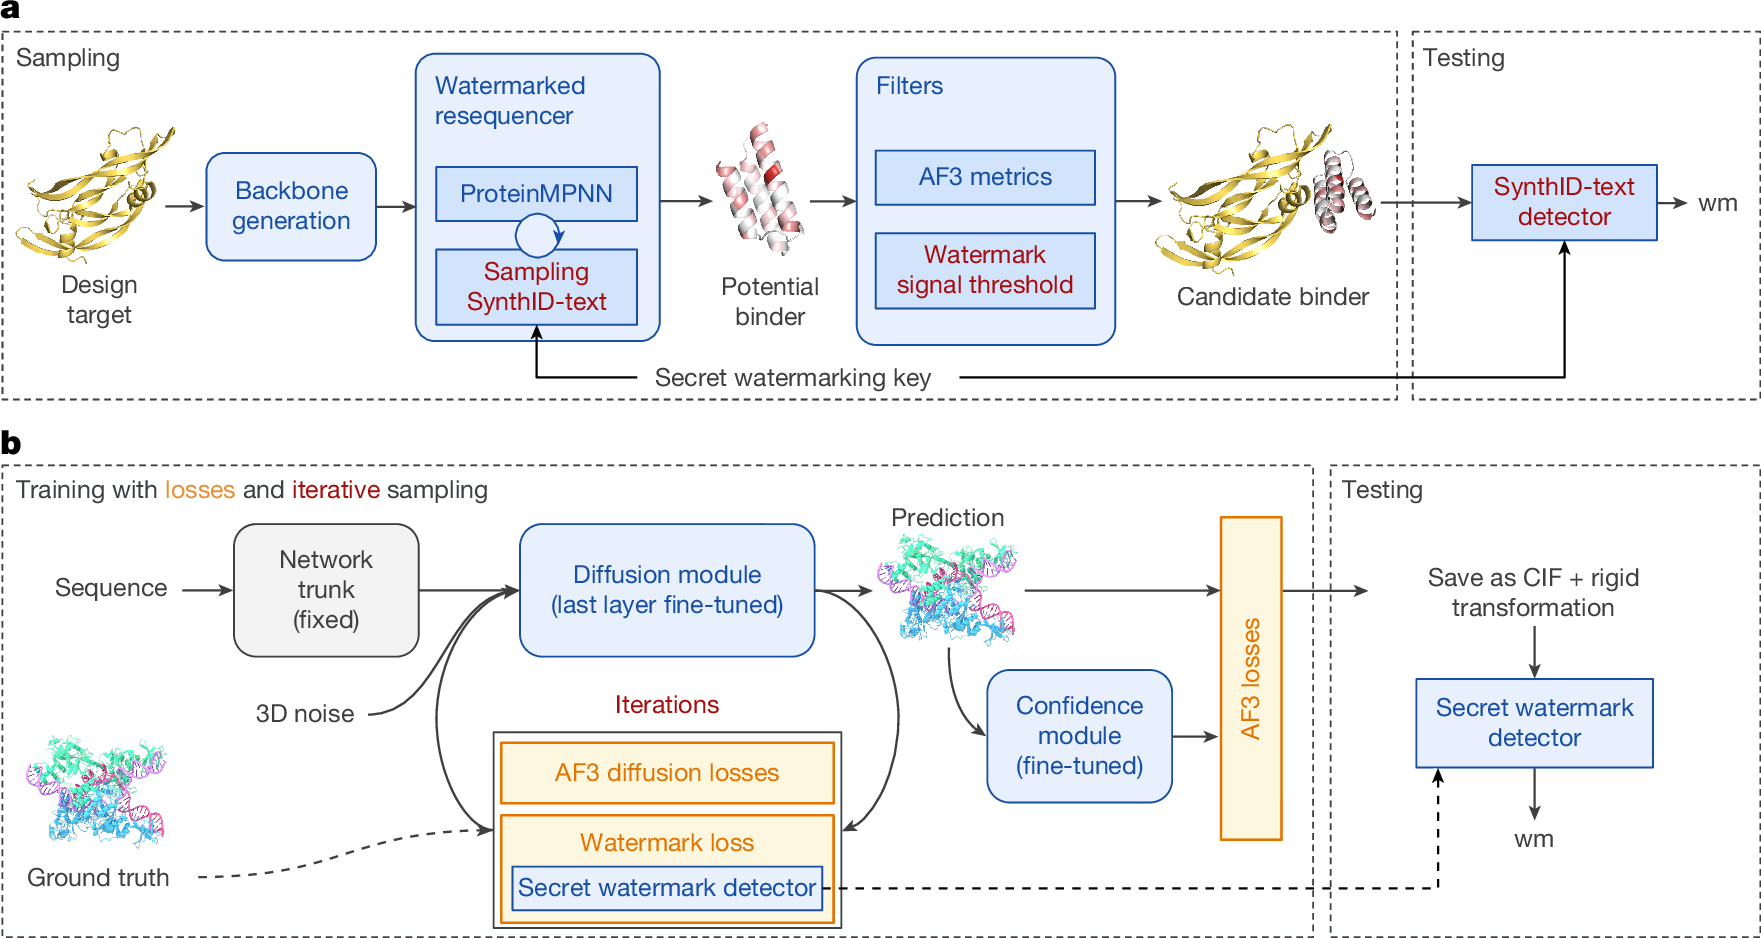
#Reading original Figure 1: the upper and lower workflows mark different objects
In the upper panel, a, the protein backbone on the left is the starting geometry. As ProteinMPNN chooses an amino-acid sequence for that backbone, a secret key introduces a small statistical preference into those choices. Generated candidates must pass both AlphaFold 3 prediction-based filters and a watermark-detection threshold before they remain in the candidate set on the right. This is a diagram of design and selection, not a photograph showing that every candidate has already been synthesized and experimentally validated.[1]
The lower panel, b, describes a separate approach. Part of a structure-prediction model is fine-tuned so that the atomic coordinates it produces carry a detectable signature. The CIF file on the right is a format for storing predicted structures. What carries this watermark is the predicted coordinate file; it does not mean that an extra identifying atom has been attached to a protein molecule in the laboratory. The two methods address different objects, and their strengths and failure modes should not be conflated.[1]
Start here New to proteins and watermarks? Start with sequence, structure and binding Open the explanation
A protein is a chain assembled from different amino acids. Its sequence records their order, rather like a string of letters. Its structure describes the shape that the chain occupies in space. Observations of the same sequence’s structure can depend on the environment and the measurement method. A computational model’s structure remains a prediction, rather than an experimental observation simply because it looks three-dimensional.
A binder is a protein designed or selected to bind to a particular target. The study tested binders for three targets: VEGF-A, PD-L1 and the receptor-binding domain, or RBD, of SARS-CoV-2. Memorizing the target names is not necessary to understand the experiment. The central question is whether adding the watermark leaves the candidate able to bind to its intended target.[1]
A watermark here is not a visible logo. A secret key or a trained detector is used to identify a statistical signature associated with the generation process. A positive detection is not an identity document proving the protein’s creator, purpose or safety. It is evidence about a particular watermarking scheme, interpreted under the detector’s assumptions and calibration.
#Why an indication of origin matters
AI makes it increasingly easy to generate protein sequences and predicted structures. A digital file can carry metadata identifying who produced it, but copying the contents or changing file formats can separate that label from the data. In biology, this creates two related but distinct questions. The sequence of a synthesized protein is an object whose design history one may want to track beyond the original file. A shared predicted-structure file needs provenance so that a model output is not mistaken for an experimental structure. Watermarking is a supplementary signal for these tasks, not a standalone replacement for signed metadata, records or other verification.[1][2]
The Nature paper presents SynthIDBio-sequence, which marks sequences during their generation, and SynthIDBio-structure, which marks structures during prediction. SynthID Bio is the name covering both. The sequence method adds watermarking to a ProteinMPNN-based design workflow; the structure method fine-tunes part of AlphaFold 3. The authors call the work a technical proof of concept. They do not establish that a provenance service has already been deployed throughout the biological industry, or that malicious transformations can no longer remove a signature.[1]
#What was directly tested in the laboratory?
For the sequence method, the important question is whether a changed sequence still binds to its target. The researchers started with backbones whose binding had already been established in earlier AlphaProteo work. For each backbone, they generated sequences with and without watermarking. This is not a test in which every protein was designed completely from scratch without an informative starting structure. Across three targets, the synthesized candidates were compared in terms of binding affinity and the hit rate meeting specified affinity thresholds.[1]
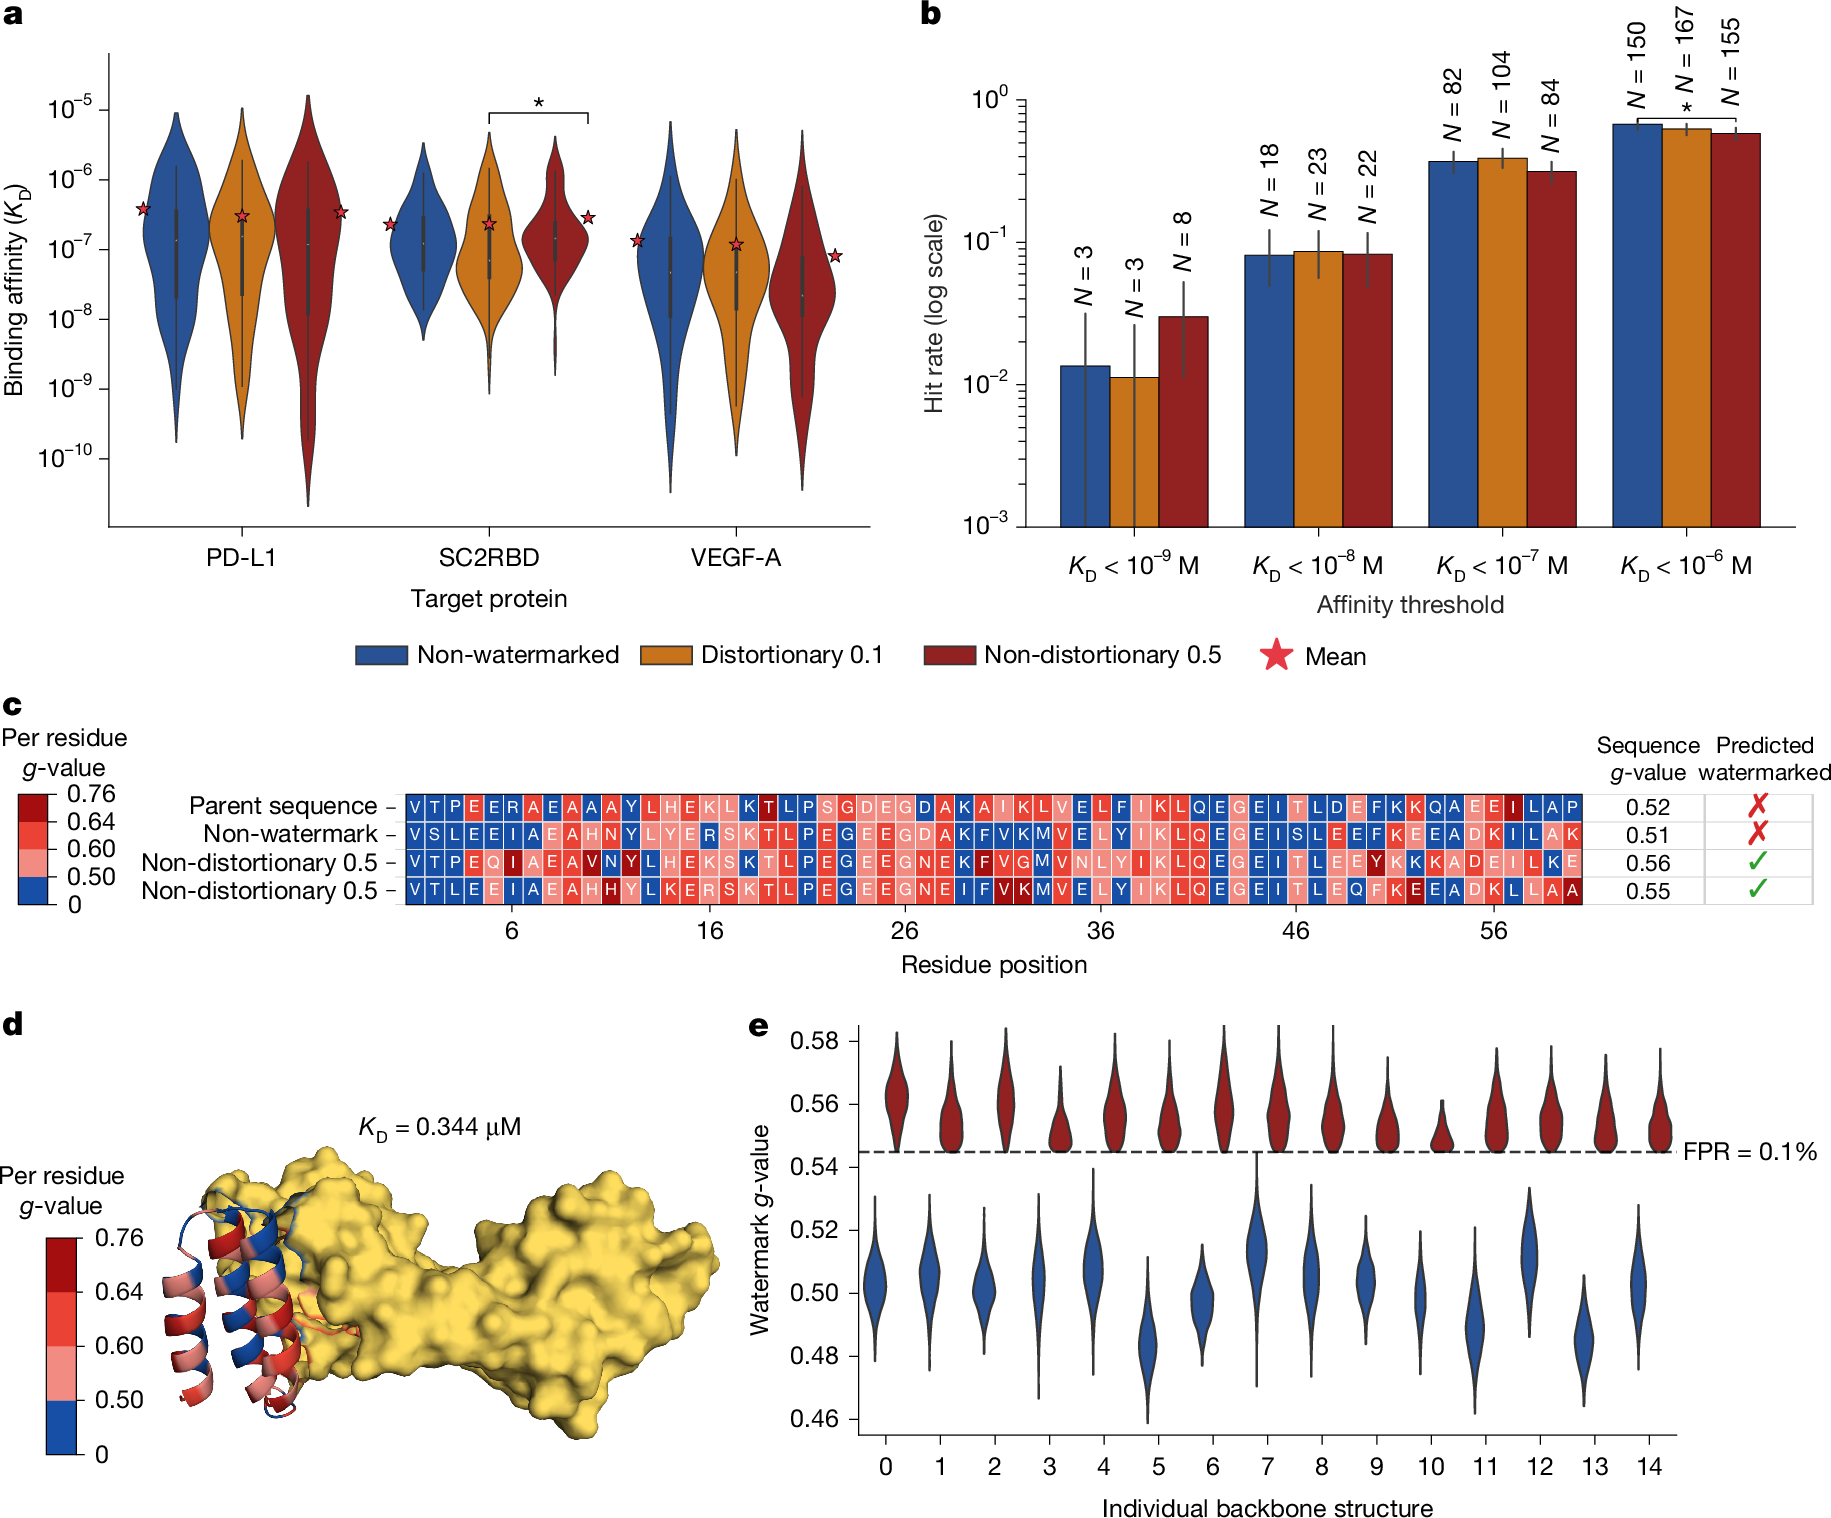
#Reading original Figure 2: first identify the vertical axis in panel a
The vertical axis in a is the dissociation constant, KD, on a logarithmic scale. A lower value generally indicates stronger binding. Blue represents candidates without watermarks; orange and dark red represent two watermarking settings. The substantial overlap in the distributions is an important observation. But the detailed results also include a significant difference between the two watermarking settings for SC2RBD and some differences in hit rate at the 10⁻⁶ M threshold in panel b. Describing every condition as completely identical would erase qualifications visible in the paper itself.[1]
In b, the horizontal axis changes the criterion for how strong binding must be to count as a hit. A threshold of 10⁻⁹ M is much more demanding than 10⁻⁶ M. The N printed above a bar counts cases for that threshold; it is not simply the total number of candidates initially generated. Panels c and d illustrate that the watermark signal is not concentrated in one sequence position or a single point on the surface. Panel e shows why further selection was needed: different starting backbones produced different signal strengths. The three-dimensional display in panel d is a predicted-structure visualization, not a microscope image of the physical molecule.[1]
What does a tenfold smaller dissociation constant mean? Expand symbols and the worked calculation
This expression is a general binding-equilibrium relationship, not a new law discovered in the watermarking study. [P] denotes unbound binding protein, [L] unbound target, and [PL] their bound complex. When concentrations are expressed in molarity, M, the dissociation constant also has units of M. In a simplified one-to-one equilibrium, 10⁻⁸ M, or 10 nM, indicates stronger binding than 10⁻⁷ M, or 100 nM. Real sensor traces, uncertainty and the binding model still need to be checked. These two illustrative values have not been substituted for the experimental distributions in Figure 2.[1]
#The denominator of “100% detection” is the selected design set
Watermark evaluation distinguishes the false-positive rate, FPR, from the true-positive rate, TPR. FPR is the fraction of unmarked objects incorrectly classified as marked. TPR is the fraction of marked objects correctly detected. The paper calibrated a threshold corresponding to a 0.1% FPR and used a filter to retain designs whose watermark scores exceeded that threshold. The experimental selected designs therefore met the criterion giving 100% TPR. That does not mean every sequence produced before filtering was detected with 100% sensitivity. Figure 3 illustrates the trade-off: stronger detectability selection lowers the fraction of generated candidates that survive, so more candidates may need to be generated.[1]
Consider an explicitly hypothetical example. If the same 0.1% false-positive rate applies to 10,000 unmarked objects, its expected count corresponds to about ten false detections. The actual count depends on the evaluated population, dependence between observations and threshold calibration. This is a way to understand the rate, not a new experiment. A positive watermark result should not become a conclusive verdict that “AI made this protein.” Moreover, the detector recognizes a particular generation-and-marking scheme; it is not a detector of all AI-designed proteins in existence.
The structure method has a different evaluation population. On the AlphaFold 3 evaluation set, TPR exceeded 99.8% at an FPR of 0.1% for the three investigated structure models. At the weakest perturbation setting, s=0.001, the authors reported no reduction relative to the baseline in LDDT or template modelling score. These are metrics of structural prediction accuracy, not measures of a physical protein’s therapeutic benefit. The authors also identify a limitation: the signature does not reliably survive molecular relaxation of the structure file.[1]
| Question | What the paper demonstrates | What it has not established |
|---|---|---|
| Physical molecular function | Laboratory binding tests for three targets, starting from known binder backbones | Preservation of every protein class, biological function or clinical effect |
| Sequence detection | Designs passing prediction and detectability filters under a calibrated FPR | Permanent traceability that survives resequencing |
| Structure detection | Digital coordinates and structural metrics on the AF3 evaluation set | A signature physically engraved into the three-dimensional conformation of a synthesized protein |
| Information content | A zero-bit test for the presence of a watermark | Creator-specific identity, complete usage history or the purpose of a design |
#What remains unresolved for security and provenance
The authors directly evaluated that sequence watermarks can be removed by resequencing. They also considered effects on the estimated likelihood of retaining a functional binder, but do not claim that removal is impossible. The structure watermark tolerates certain transformations, including rotation and small perturbations, yet remains vulnerable to relaxation. Both methods currently use a zero-bit format: they indicate watermark presence rather than encoding the names of laboratories or individual users. Their possible value for biological safety and scientific integrity therefore comes with a need for technical development, coordination and operational standards.[1]
The direct observations concern particular design workflows, evaluation sets and binding experiments for three targets. They do not justify statements such as “a watermark proves the protein is safe,” “an absent watermark proves a human designed it,” or “all AI proteins can now be traced.” The newsworthy contribution is that embedding an indication of origin while retaining utility has been taken beyond a purely computational proposal and connected to laboratory binding measurements. Preserving that evidence boundary is more informative than describing the result as a permanent or universal biological signature.
Availability also needs precise wording. The study releases sequence-watermarking code and in-vitro validation data, and describes access instructions for the recommended s=0.001 structure-model weights in the same repository. This is not a claim that its secret detector or every production service is unrestricted public infrastructure. The paper discloses Alphabet funding and that all authors are Alphabet employees and may hold stock. Open implementation, peer review and disclosed interests are information to consider together; independent laboratory replication remains a further step.[1][3]
#Sources and figure rights
[1] David Stutz et al., “Function-preserving watermarking of AI-generated proteins,” Nature, published 30 September 2026, DOI 10.1038/s41586-026-10965-y. The Korean source article records checks of Results, Methods, Figures 1–4 and the rights statement on 1 October 2026. The current publisher HTML was rechecked during this English update on 5 October 2026. Original paper.
[2] Google DeepMind, “Introducing SynthID Bio,” 30 September 2026. This is the research team’s official explanation. Quantitative claims in this article use the scientific paper, rather than treating a promotional summary as independent validation. Official explanation.
[3] Google DeepMind, SynthID Bio official code and validation-data repository. The scope of availability described here follows the paper’s Data and Code availability statements; this update did not install the biological design software or reproduce its experiments. Official repository.
Both reproduced images are the original PNGs of Figures 1 and 2, with all panels, axes, colors and annotations unchanged. The paper is licensed under CC BY 4.0, and the source article records no separate third-party restriction in these two captions. Each figure retains its author attribution, paper and license links, and a statement of whether changes were made. This is a complete English translation of the existing October 1 Korean explainer, including its worked example, beginner explanations and qualifications; it is not a new independent laboratory validation.