#The 30-second summary
- Method. The visual branch caches a memory and a base action chunk. Between visual updates, the tactile branch adds a correction, or residual, only to valid actions that have yet to execute.
- Evidence. The paper separately evaluates human hand-motion prediction and four physical robot tasks. Table 2 reports unweighted means of 50.0% and 47.25%. The reviewed material does not establish the number of evaluation trials or the procedure for estimating uncertainty.
- Limits. The 30 demonstrations per task were used for adaptation training. The coordinate conventions behind the hand-prediction table also remain unresolved, so this article does not rank models using that table.
- Source status. The source is an arXiv v1 preprint. Peer-reviewed journal publication was unconfirmed at the time of review.
#Does a robot have to replan visually at the moment of contact?
A robot reaching for an object can see the object and its surroundings through cameras, while fingertip sensors report changes in contact or slip. Vision provides scene and goal context, but recomputing a long plan with every new image can be costly. Touch measures local contact more directly, while providing less information about the overall scene.
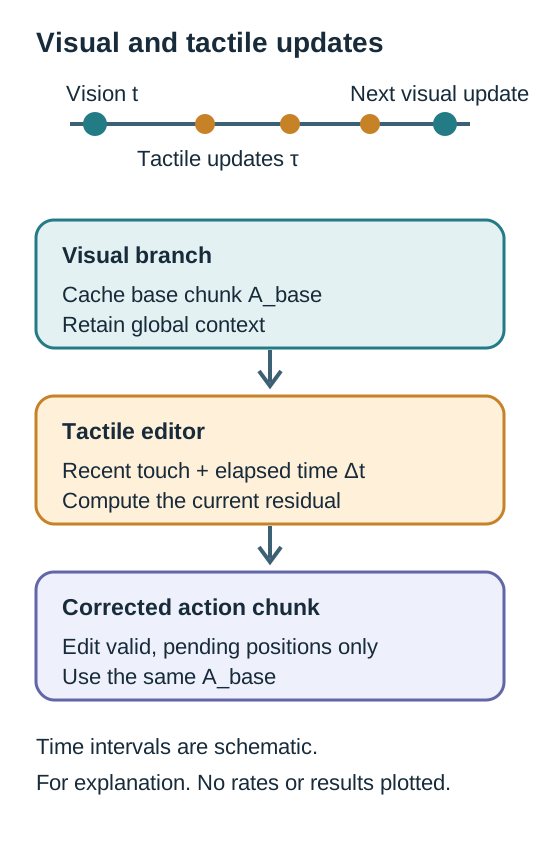
T-WLA assigns the two senses different roles and update schedules. At visual update , the visual branch builds and caches a scene memory and a multistep base plan. An action chunk is an ordered sequence of actions for the robot to perform. Several tactile updates may occur before the next visual update. The tactile branch uses recent touch history and the age of the current chunk to correct positions that have yet to execute. and index the update sequence, while is actual elapsed time in seconds.
 Open full-size image in a new tab
In the hand-motion prediction setting the authors report 39.7 visual updates and 119.1 tactile corrections per second (39.7 and 119.1 Hz). These frequencies describe that setting. They do not measure the latency from contact to completion of a physical action or a performance improvement caused by the method.
#How does touch edit the visual plan?
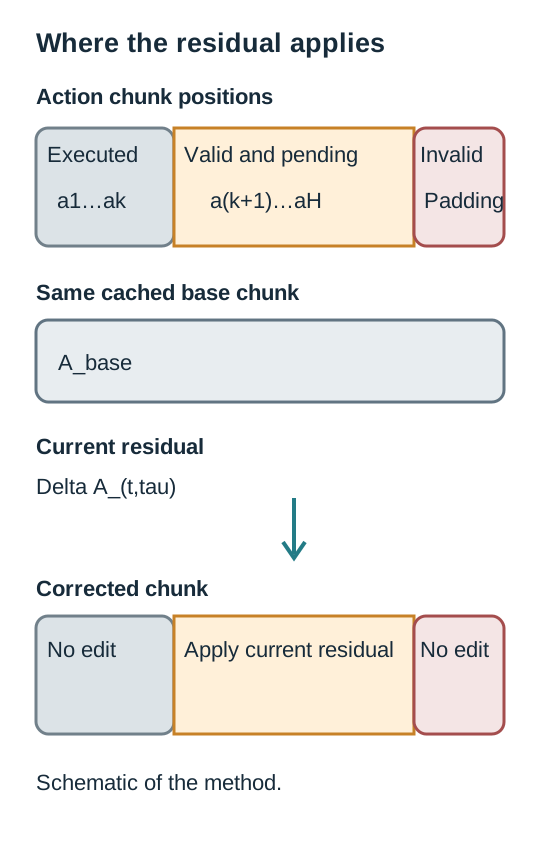
A residual is a correction added to an existing plan. A mask specifies which positions to include or exclude. Executed positions and padding positions should receive no new residual.
Which cached plan does touch correct? Scroll sideways for long equations. Focus the equation and use arrow keys with a keyboard. Expand symbols and the worked calculation
Source: Section 3.1, Equation (1), PDF page 4. This is the learned policy’s update rule.
The equation summarizes how the learned policy produces an action chunk. uses visual memory to produce base chunk . In the paper’s notation for , V is a subscript and t a superscript. The tactile editor receives the same visual memory, the original base chunk, tactile context and time since the chunk began. names the editor here, rather than an expectation operator. The output is the corrected chunk.
The base chunk stays in the cache after editing. At the next tactile update the editor recalculates a residual relative to the same original . It does not compound each edit on top of the previous correction. The mask passes only valid, unexecuted positions. Missing or invalid touch history zeroes the editing context. The action mask excludes executed and invalid positions.
The symbols also have different units. is in seconds and the implementation multiplies it by 10 before the time projection. and are learned representations without physical units of distance or pressure. Appendix D.1 describes a chunk of 16 positions with 192 channels per position, 138 for action data and 54 for padding. Channels include wrist translation, rotation and joint components, so as a whole has no single physical unit. The paper does not assign a common unit to all action channels.
Hypothetical sequence. Suppose positions 1–6 have already executed. The tactile editor can change only valid, unexecuted positions starting at 7. Invalid positions and padding remain excluded. These indices illustrate the mask and supply no experimental action magnitudes or performance measurements.
 Open full-size image in a new tab
Gray denotes executed positions, amber valid unexecuted positions and red padding.
#How touch becomes a residual
The model sends the current touch history for each hand and a fixed reference history through the same encoder. It uses the difference between the internal representations as its tactile context. The following equations show how that difference is formed and how the updates for both hands are produced.
What reference is the current touch compared with? Scroll sideways for long equations. Focus the equation and use arrow keys with a keyboard. Expand symbols and the worked calculation
Source: Appendix B.2, Equation (6), PDF page 17. The equation defines the tactile context.
denotes the left or right hand. is the touch history observed so far for that hand, and its fixed reference history. is the shared tactile encoder. indicates whether the history is valid. An invalid history gives zero context for that hand. The encoder outputs are normalized before subtraction. The difference itself is not normalized again. Thus is a learned feature representation and cannot be read as a pressure measurement.
Which components of the action chunk can touch change? Scroll sideways for long equations. Focus the equation and use arrow keys with a keyboard. Expand symbols and the worked calculation
Source: Appendix B.3, Equations (7)–(8), PDF pages 17–18. These define the per-hand residuals and edit mask.
In Equation (7), tactile context produces per-hand scales and shifts to modulate action features. An output layer turns the modulated features into a candidate residual for each hand. Equation (8) masks each hand’s candidate and sums the left and right residuals. These equations describe the editor inside Equation (1). There is no additional stage that adds the same tactile context a second time.
#Earlier approaches to the same problem
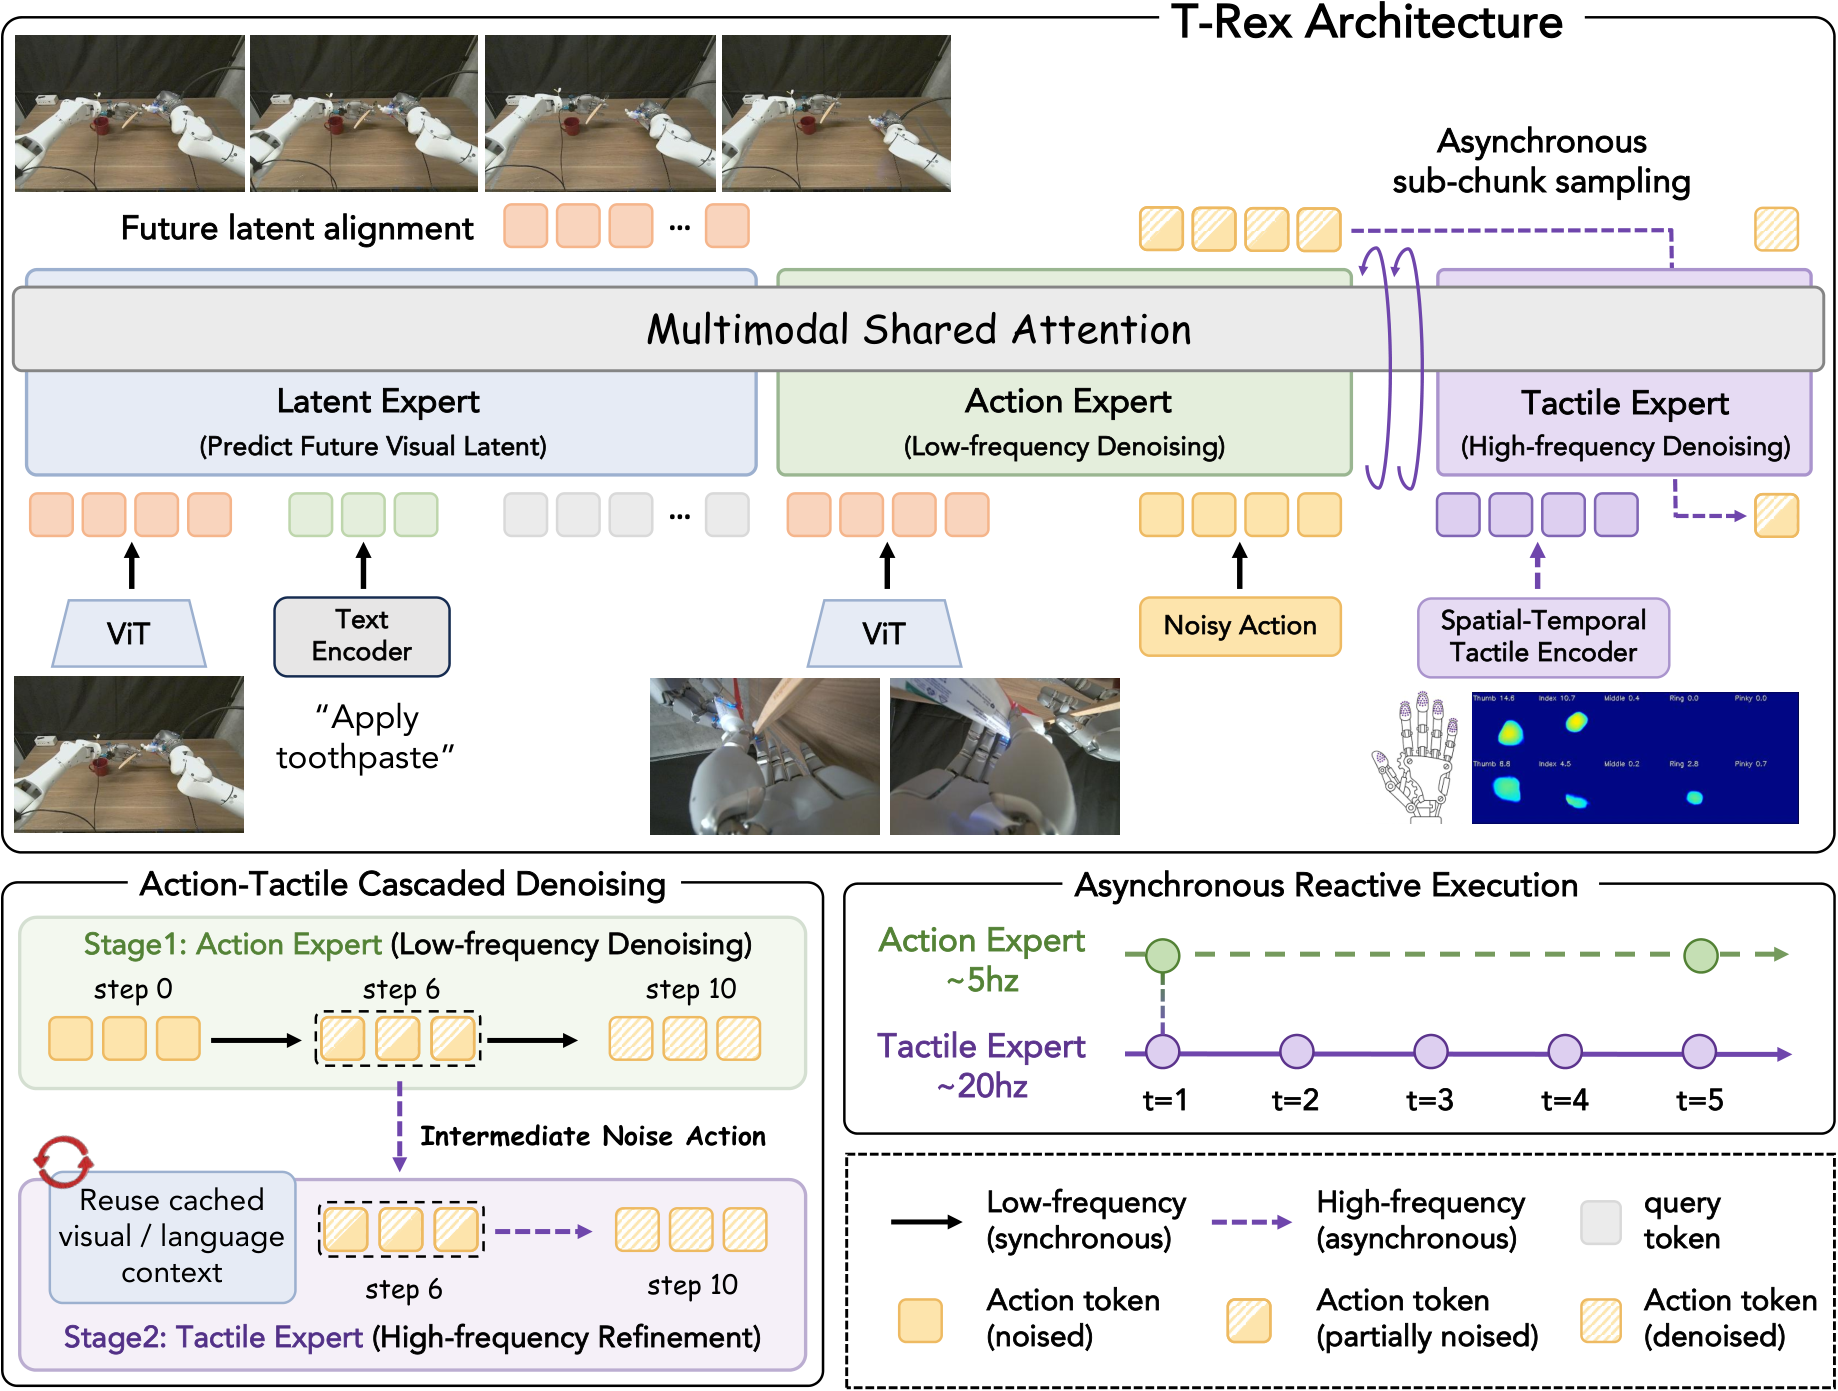
Earlier work also combines slow planning with fast touch, but the methods hand off the plan in different ways. In Reactive Diffusion Policy (RDP), a slow policy creates a latent action chunk and a fast tactile decoder issues the next actions sequentially from it. T-Rex divides iterative action denoising between a slow expert that runs the first stages and a fast tactile expert that completes the remaining ones. ViTaR selects candidate residuals using evidence of effects and preferences, and scales them with tactile context.
 Open full-size image in a new tab
Start at the lower left of this figure from prior work to see how computation is divided. Here denoising is the generative process that turns a noisy action representation into an action over several computational steps. It does not refer to filtering noise out of the tactile sensor.
- Locate the green Action Expert, which runs the initial denoising steps.
- Follow the purple handoff line. The intermediate action passes to the Tactile Expert, which uses touch to complete the remaining steps.
- The roughly 5 Hz and 20 Hz labels on the timeline at right refer to T-Rex. They cannot be compared directly with 39.7 and 119.1 Hz from the T-WLA hand-prediction setting. Open the figure to enlarge the small labels.
In T-WLA, the question is which plan a new touch sample edits. A residual from the new touch is added to the valid, still-unexecuted portion of the cached base chunk. The comparison here concerns the architectures described by the authors of each paper. A head-to-head performance comparison would require matched conditions. RDP paper, T-Rex paper, ViTaR paper
#What changes between training and execution?
Training proceeds in stages. First, the visual branch learns base actions and future video prediction. Next, the tactile encoder receives separate contrastive training, pairing representations of touch and hand posture from the same moment. In the final editor-training stage, the visual branch is frozen while the tactile editor learns the residuals. Future video and pressure predictors supply auxiliary training signals in this stage and are removed at execution time. The deployed policy does not receive those auxiliary future outputs.
What does the editor learn, and why penalize the residual? Scroll sideways for long equations. Focus the equation and use arrow keys with a keyboard. Expand symbols and the worked calculation
Source: Appendix C.1, Equation (12) on PDF page 18 and Equation (13) on pages 18–19. Both are editor training losses. Neither places a bound on residuals during execution.
indexes a demonstration in a minibatch, an action position and an action component. contains the components in group . is the corrected action chunk and the demonstrated target, with componentwise error . The mask retains only valid entries that can be edited and supervised. Thus counts the supervised entries in demonstration for group . is the set of groups with at least one such entry, and the set of demonstrations with at least one supervised group.
Equation (12) fits corrected actions to the demonstrations. It first averages across valid entries within each group, then gives each nonempty group in a demonstration equal weight, and finally averages across demonstrations with supervision. is a Smooth L1 function. It uses half the squared error for absolute errors below one and grows linearly thereafter. These successive group and demonstration averages differ from pooling all hands and components in one mean.
Illustrative calculation with dimensionless values. If group A has errors [0, 2], its values are [0, 1.5], averaging 0.75. Group B’s error [1] yields 0.5. Equation (12) averages the two group means to give (0.75+0.5)/2=0.625. Pooling all three entries would give 2/3. The values illustrate aggregation order and do not come from the experiment.
In Equation (13), is the effective residual actually added to the base action at that position. The denominator counts all action components admitted by the mask. The equation averages the squared residual over all valid components once, without reweighting by group or hand as in Equation (12). Illustrative dimensionless residuals of [0.1, 0.2, 0.3] give a mean square of about 0.0467. If the supervised demonstration set is empty, Equation (12) gives zero. Equation (13) is defined as zero if its count of valid entries is zero.
The action channels contain different coordinates for translation, rotation and joints. The paper specifies no additional channelwise physical-unit conversion for this loss, so neither nor as a whole has one physical unit. The penalty encourages small residuals in training. It cannot guarantee bounded residuals or successful robot behavior during execution. The source does not provide a combining coefficient or single weighted-sum objective here.
Earlier methods use different training objectives. RDP Equation (2) describes L1 action-chunk reconstruction and a KL term for an asymmetric tokenizer using tactile representations. Equation (3) gives the noise-prediction objective for the slow latent diffusion policy. T-Rex Appendix B, Equations (8)–(9), trains the action and tactile experts to reduce squared error in a shared flow velocity. Equation (10) combines these losses with a future-video prediction loss. These are comparisons in the broad context of action learning. The reviewed equations do not show a direct counterpart to Equation (13)’s mean-square penalty on effective residuals, or establish that the methods use T-WLA’s masked, group-averaged loss in Equation (12). This observation is confined to those equations and does not compare the complete losses or performance. RDP Section IV-B1, Equation (2) · T-Rex Appendix B, Equations (8)–(10)
Table 3 in Section 4.4 offers an additional method-specific observation. The authors describe matched ablations for human hand prediction on EgoTouch and Tachin, and report that removing touch caused the largest increase in finger-joint error. The coordinate-frame question below also applies to this table. This review does not calculate an improvement percentage, rank the results or treat the hand prediction as a physical robot success rate.
The paper presents two different evaluations. Table 1 concerns future human hand movements on EgoTouch and Tachin. Section 4.2 calls the finger metric wrist-relative MPJPE (mean per-joint position error). Appendix D.1 describes joint channels in palm-local coordinates. Appendix D.2 says stored palm-local positions are compared directly, without subtracting the predicted wrist position again. Whether the exact D.2 computation also applies to Table 1 remains unresolved. Numeric rankings and improvements in that table would depend on the coordinate conversion. This observation alone does not demonstrate an error in the paper.
Table 2 reports success rates for four physical robot tasks and their simple mean. The paper’s unweighted means are 50.0% for T-WLA with touch and 47.25% for the related model without touch. Their arithmetic difference is 2.75 percentage points. This is a descriptive comparison. The authors used 30 teleoperated demonstrations per task for adaptation training. The reviewed tables, text and appendices did not identify evaluation trial counts or how repetitions and uncertainty were handled. The 30 demonstrations cannot supply the evaluation sample size, statistical significance or a causal claim that touch improved success.
#Read the figures and try the calculations
Consider each question before opening the answers. New numerical examples below are hypothetical.
- Read the original figure. At the lower-left handoff from the green Action Expert to the purple Tactile Expert in T-Rex, does the second expert restart a completed action from the beginning, or continue from an intermediate representation? Identify the arrows and labels that support your answer.
- Find the editable positions. Suppose a chunk has positions 1 through 6. Positions 1 and 2 have executed, position 6 is invalid padding, and positions 3, 4 and 5 are valid and pending. Where can the new tactile residual apply? What changes once position 3 has executed?
- Calculate the loss average. For one sample in Equation (12), the two groups have one and three valid entries respectively. Their already-computed group mean losses are 1 and 3. What is the mean across groups? How does it differ from averaging all four entries? What if the first group has no valid entries?
- Interpret the result. Calculate the difference between 50.0% and 47.25% in Table 2 in percentage points. Can that difference and the 30 demonstrations per task establish actual success counts or statistical significance? What else would you need?
Answers and supporting evidence
- The tactile expert continues from an intermediate representation. Look for the purple handoff line, “Intermediate Noise Action,” and the step 6 marking in both stages. The figure describes the T-Rex architecture rather than a T-WLA experiment.
- Initially positions 3, 4 and 5 can change. After position 3 executes, only 4 and 5 remain eligible. Executed positions and invalid padding are excluded. Each edit uses the original cached base chunk. Earlier tactile corrections are not accumulated into its reference. Compare the residual and mask diagram, Equation (1) and the scope specified in Appendix B.3.
- Giving the two group means of 1 and 3 equal weight yields 2. If every valid entry were pooled, the first group would contribute a sum of 1 and the second a sum of 9, giving 10 ÷ 4 = 2.5. Equation (12) first averages within each group, then across nonempty groups. If the first group is empty, it is excluded and only the second group’s mean of 3 remains for this sample. The equation explanation above also covers averaging across samples and the no-supervision case.
- The difference is 2.75 percentage points. The 30 demonstrations were used for adaptation training. Success counts require per-task and per-model evaluation denominators and the aggregation rule. Assessing uncertainty or significance also requires the repetition and sampling design and the analysis method. The reviewed material leaves these details open.
Scope and sources
#What the sources establish
The sources document how T-WLA combines cached visual memory and base actions with tactile residuals, the update frequencies reported for hand-motion prediction and the descriptive success rates in Table 2. Figures from different experimental settings must retain their separate denominators. The coordinate scope for Table 1 and evaluation denominators for Table 2 remain unconfirmed, precluding numerical rankings, improvements, significance claims or exact success counts from these data.
On November 9, 2026, the official arXiv record showed v1 submitted October 20, 2026 and listed no journal publication. The abstract directed readers to the project page for code. That page had demonstrations, but this review could not verify a repository link at the time. The account describes the preprint and does not establish peer review or independent reproduction.
- T-WLA: Bridging Slow Vision and Fast Touch, arXiv:2610.28814v1 — method in Sections 3.1–3.4, evaluation in Sections 4.1–4.3, Appendices B–F. DOI 10.48550/arXiv.2610.28814.
- Related methods: Reactive Diffusion Policy, T-Rex, ViTaR. The descriptions follow each original paper. A matched performance comparison has not been made here.