Even a teacher who does not know every answer can help a student make better use of an existing ability.
Part 11 followed a strong AI that designed and ran training for a smaller model. Now reverse the teacher-student relationship. Can a teacher who gets more answers wrong supply a useful training signal for a student with greater latent ability?
This is the question of weak-to-strong generalization. The student already has representations and capabilities from pretraining. The problem is whether learning from a weak teacher’s answers will elicit those capabilities or teach the student to reproduce the teacher’s errors.
There are two levels to keep separate. At the inner level a weak teacher supervises a strong student. At the outer level an AI researcher designs and improves the learning method. This distinction makes clear what the experiments improved and which claims remain open.
Video timestamps by slide
| Slide | Video | Topic |
|---|---|---|
| 56 | 58:39–59:07 | Anthropic’s automated alignment research |
| 57 | 59:07–1:00:17 | The weak-teacher, strong-student experiment |
| 58 | 1:00:17–1:01:17 | Students outperforming their teachers and variation across tasks |
| 59 | 1:01:17–1:02:39 | AI designing learning algorithms |
| 60 | 1:02:39–1:03:02 | The lecturer’s assessment of self-improvement at the time |
#Slide 56 — What happens when AI runs alignment experiments?
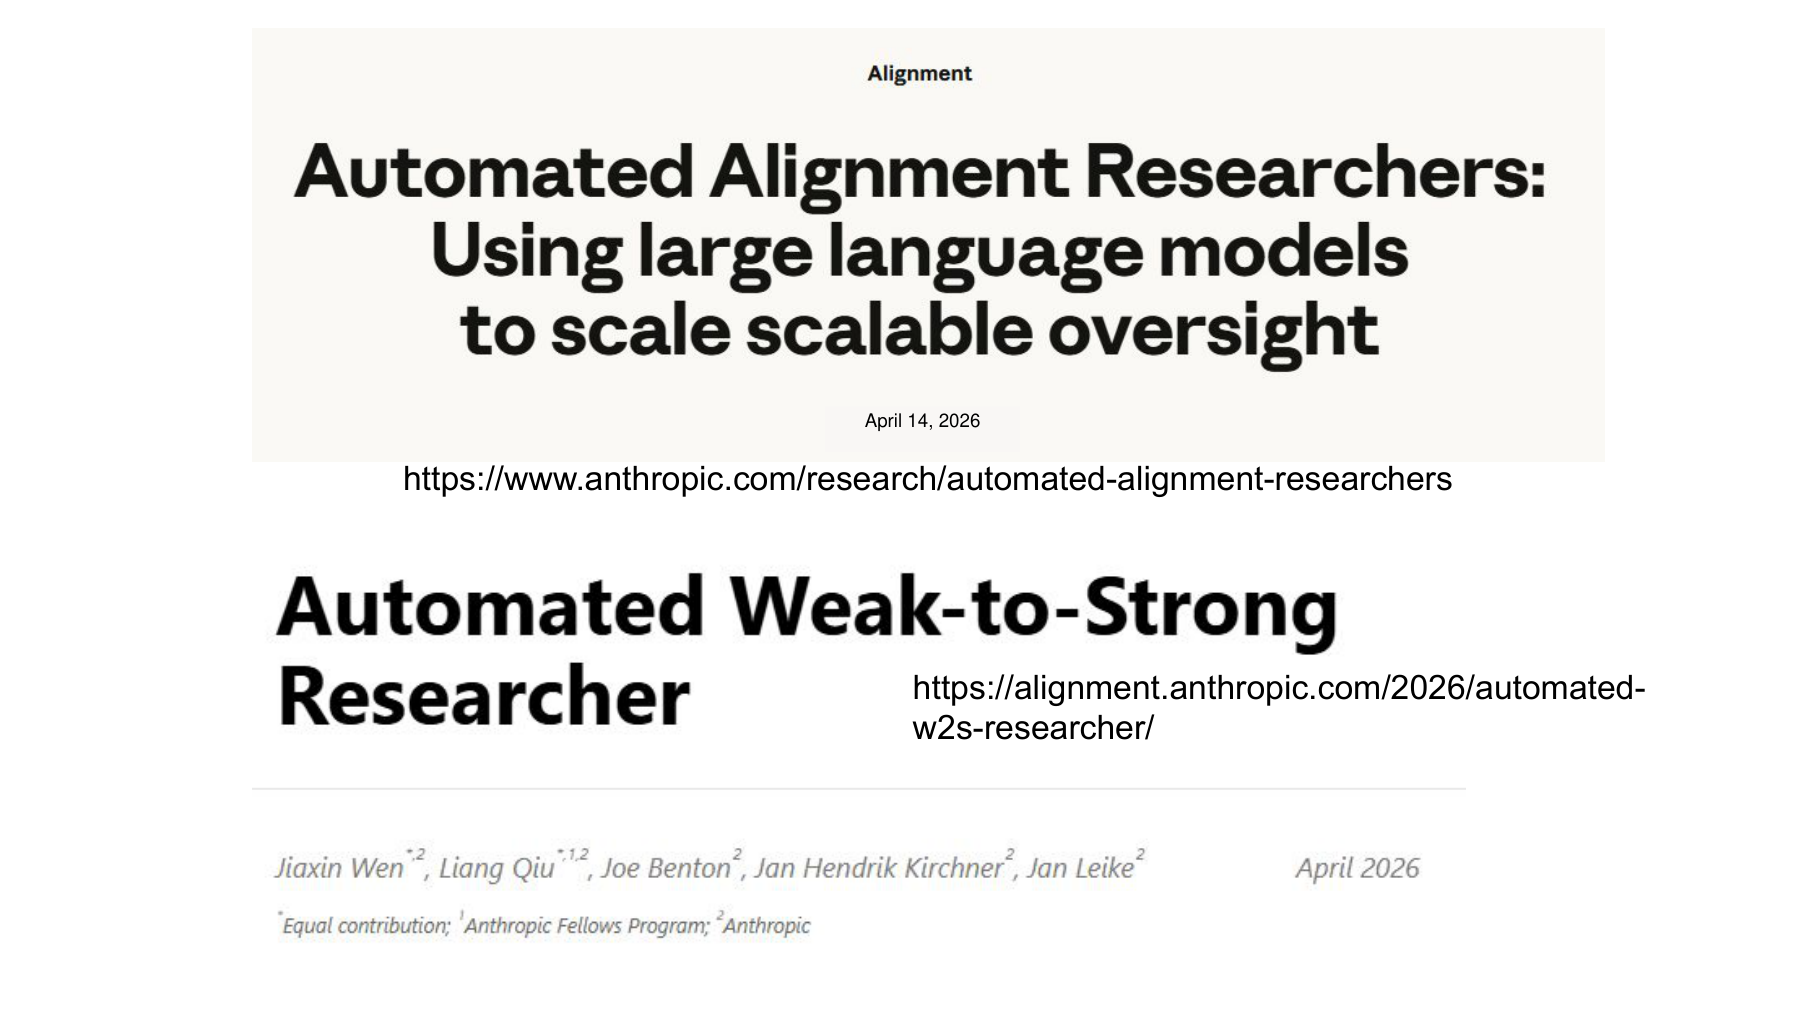
At 58:39, the lecturer introduces the automated alignment research Anthropic released in April 2026. The AI proposes training ideas, runs code, analyzes results and chooses the next experiment. The researchers call the system an Automated Alignment Researcher (AAR). Anthropic research overview · Technical report §2
#Three model roles
The word “strong” can be misleading without distinguishing three roles.
| Role | Model used | What it does |
|---|---|---|
| Weak teacher | Qwen1.5-0.5B-Chat | Supplies labels or evaluation signals for training the student |
| Strong student | Qwen3-4B-Base | Learns from weak signals and is evaluated for generalization beyond its teacher |
| AI researcher (AAR) | Claude Opus 4.6 agent | Designs and tests ways to train the student |
“Strong student” compares the student with its teacher. The experiment does not show that the student became stronger than Opus, the researcher. Updating the student’s parameters does not update Opus’s parameters. The lecture emphasizes this at 1:02:18. Technical report §1–2
#Further reading — The researchers use an experimental environment and feedback
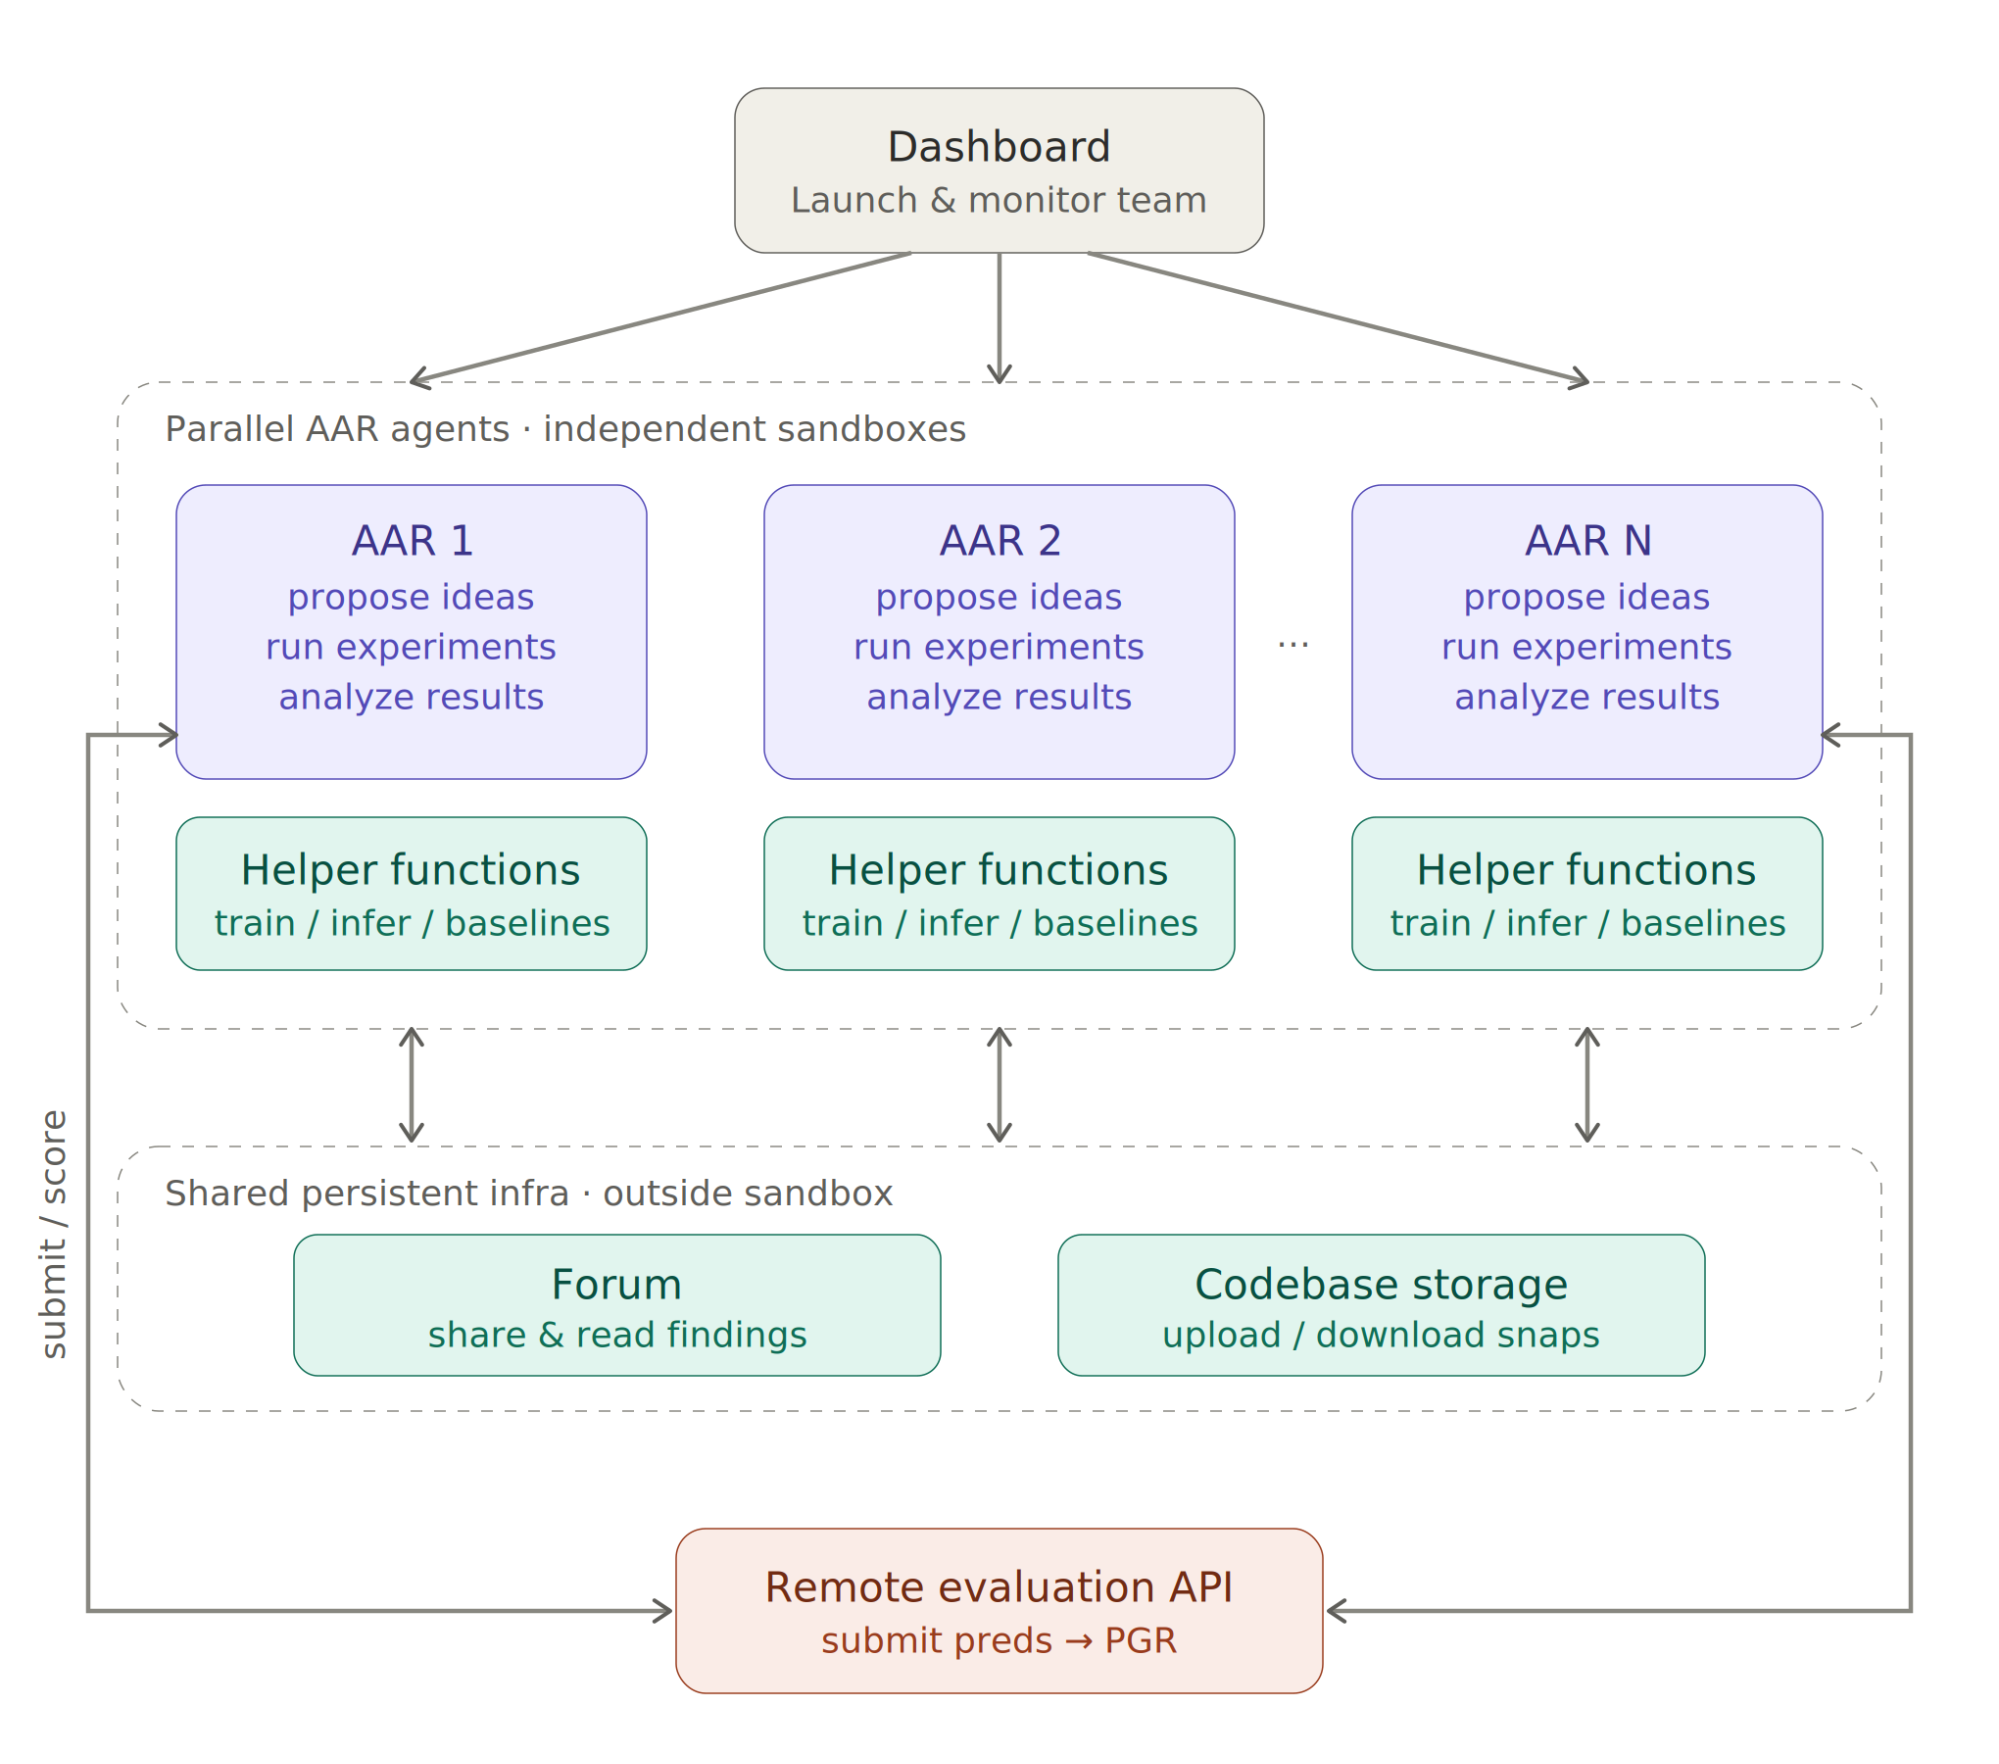
The figure shows several research agents at the top. Each formulates hypotheses and experiments in an independent workspace. The forum and code repository below let agents read and build on one another’s findings. A remote evaluation API scores submitted predictions. Technical report §2, environment diagram
People define the research question, data, models, evaluation rules and available tools. AI searches within that environment. Interpretation therefore depends on both the quality of the methods the AI finds and the quality of the evaluation environment people designed. A score can be easy to compute and still capture only part of the research goal.
For a preference task that asks which of two responses is better, the intended skill is comparing their actual quality. If length, style or the identity of the generating model correlates with the preferred answer, a method can score well using those traces alone. We return to this issue below.
#Slide 57 — A weak teacher need not set the student’s limit
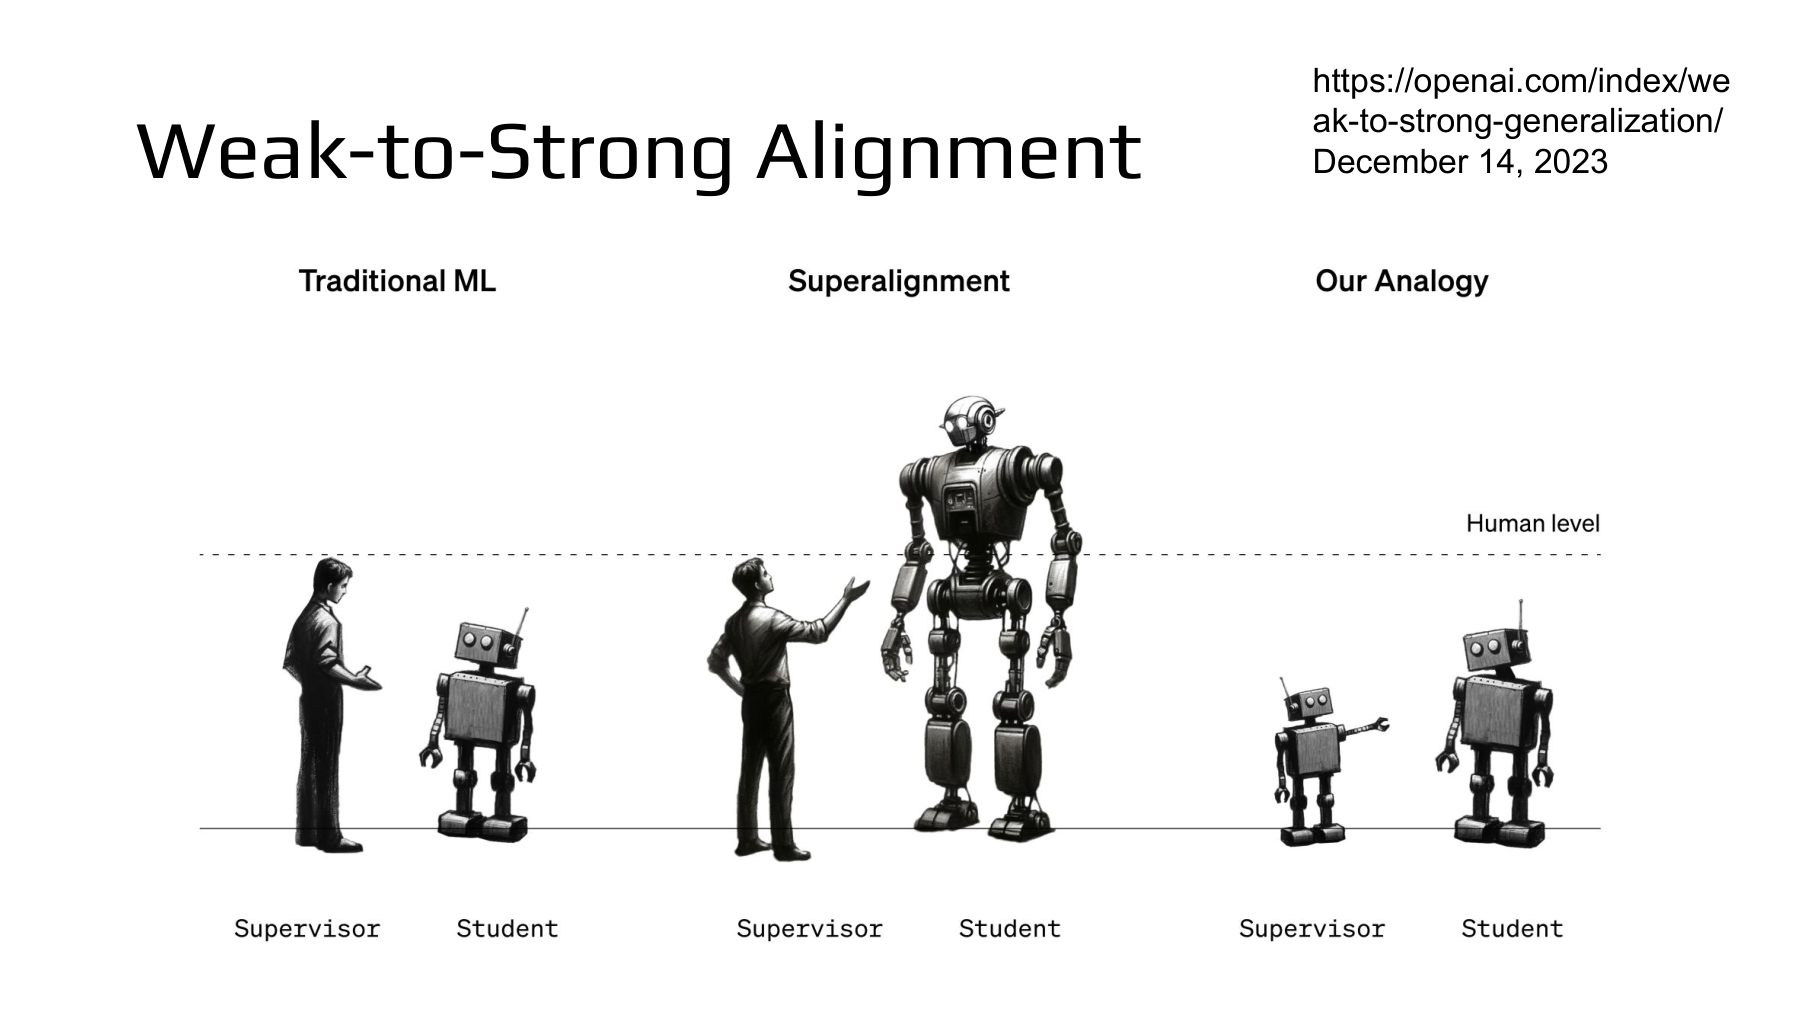
At 59:07, the lecture turns to OpenAI research released on December 14, 2023. On the left, humans judge a task better than the model in conventional supervised learning. In the middle, a model is strong enough that a human cannot accurately evaluate all its outputs. On the right, a small model serves as teacher to a larger pretrained student to make part of that problem experimentally accessible. OpenAI research overview · Paper, Figure 1
#How can training elicit an ability the student already has?
For a student starting from scratch, outperforming its teacher might seem difficult. The student here has already finished pretraining. It may represent language, conceptual relationships and task rules. Weak labels provide an imperfect signal about how to connect those representations to an answer.
Suppose a student represents sentence meaning well but has yet to map it to the right output on a new classification task. Even with labeling errors, patterns that recur across examples and match the student’s representations may support a better decision rule. Conversely, easily imitated teacher errors can become student errors. Pretrained capabilities, the structure of errors and the objective jointly determine the outcome. Paper §1, §5
Consider binary classification. For input x, let q(x) be the teacher’s probability of the positive class and pθ(x) the student’s probability. The student can minimize the mean binary cross-entropy against the weak labels.
| Symbol | Meaning | Range or unit |
|---|---|---|
| x | Input to classify | A sentence, a pair of responses or another task-specific input |
| q(x) | Teacher’s positive-class probability | 0–1, dimensionless |
| pθ(x) | Student’s positive-class probability | 0–1, dimensionless |
| N | Number of training examples | Count |
| BCE | Loss for matching the two probabilities | Nats with natural logarithms |
The objective does not identify teacher errors. In isolation, each example pressures the student to match the teacher’s probability. Generalization beyond the teacher must come from shared representations, limited training, additional regularization or the structure of the data. Using cross-entropy alone does not guarantee that the student surpasses its teacher.
#Three comparisons
The OpenAI study trains a small model on ground truth to produce a weak teacher, then trains a strong student on the teacher’s predictions for separate examples. For comparison, it trains the same strong model with ground-truth labels. Paper §3
| Comparison | Training signal | Question |
|---|---|---|
| Weak teacher | Ground truth | How well can the teacher perform? |
| Strong student under weak supervision | Weak teacher’s predictions | Does it generalize better than the teacher? |
| Ground-truth-trained strong reference | Ground truth | What performance gap is available to recover in this setup? |
The paper calls the last reference strong ceiling performance. It is a comparison measured with the specified data and training procedure. It is not a mathematical upper bound over every possible method. Ground truth is used for evaluation and reference models, separately from the usual training labels of the weakly supervised student.
#Slide 58 — Student accuracy and the fraction of the gap recovered
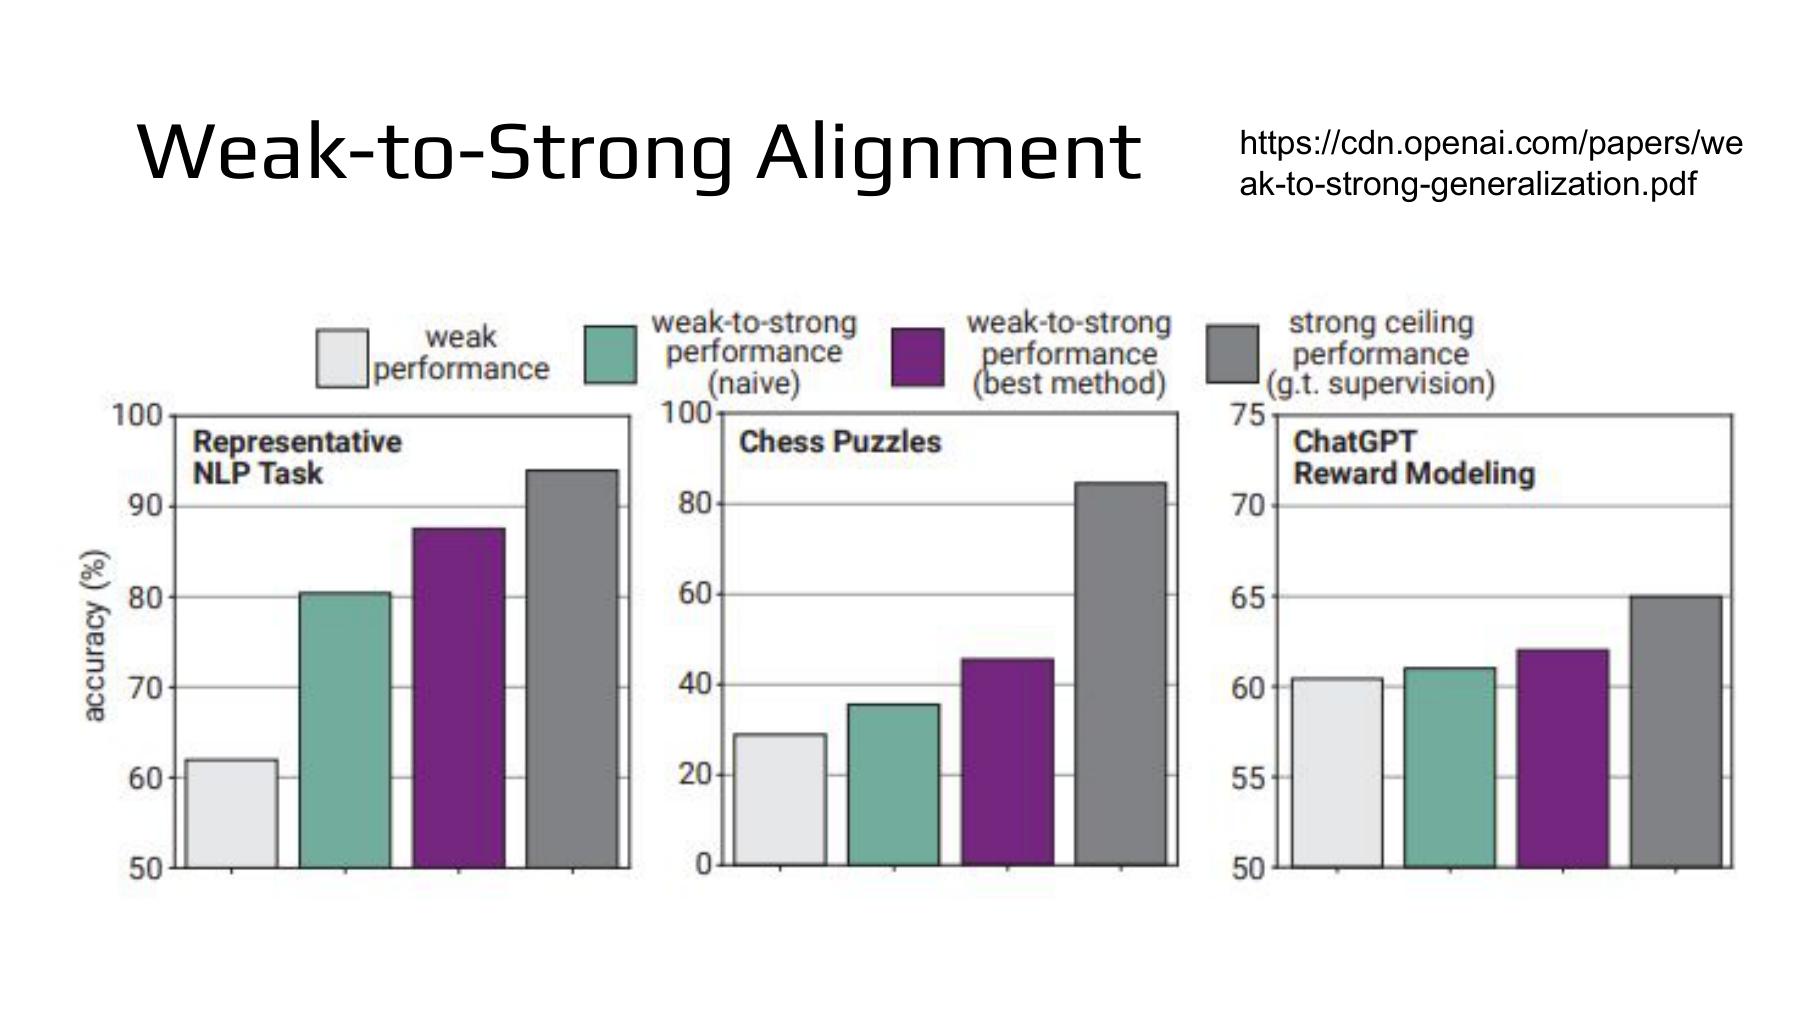
At 1:00:17, the lecturer uses Figure 2 of the OpenAI paper to show that a weakly supervised student can outperform its teacher. Light gray denotes the weak teacher, green simple training on weak labels, purple a method that worked better for the corresponding setting, and dark gray the strong reference trained on ground truth. Paper, Figure 2
Three details matter when reading this figure.
- The three panels use different vertical scales. Visual differences in bar height can misrepresent the actual accuracy gaps.
- The purple bars represent different algorithms. NLP uses an auxiliary confidence loss, chess bootstraps through an intermediate-size model, and reward modeling uses unsupervised generative fine-tuning.
- The student sizes differ too. The NLP and chess panels use a GPT-4 student and reward modeling a GPT-3.5-level student. The paper uses GPT-2 and GPT-3.5 “levels” to describe scale and performance. The experimental model family uses architecture and pretraining data from the same family as GPT-4. Paper, Figure 2, §1 footnote 1
The behaviors evaluated also differ. NLP covers 22 binary classification tasks, chess predicts the first move in a puzzle, and reward modeling predicts a human preference between two responses. The reward modeling experiment does not extend to reinforcement learning of a policy with that reward. Paper §4.1
#Performance gap recovered (PGR)
A five-point student gain can have a different meaning on a task where the teacher scores 60 and one where it scores 85. The available gap differs. Performance gap recovered (PGR) measures the gain relative to that gap.
| Symbol | Meaning |
|---|---|
| Aweak | Weak teacher’s performance |
| Aw2s | Strong student’s performance after weak supervision |
| Aceiling | Strong reference model’s performance after ground-truth training |
All three values must use the same evaluation set and metric. A positive denominator gives the natural interpretation of a gap available to recover. At zero the ratio is undefined. With a very small denominator it is sensitive to small measurement errors. Paper §3, PGR definition
For example, suppose the teacher achieves 60% accuracy, the student 78% and the strong reference 90%.
Student accuracy is 78% and the fraction of the gap recovered is 60%. A student below the teacher can have negative PGR, while one above the measured strong reference can exceed 1. PGR=0.97 represents neither 97% accuracy nor a 97% probability of successful alignment.
#Further reading — Training a student to avoid copying teacher errors
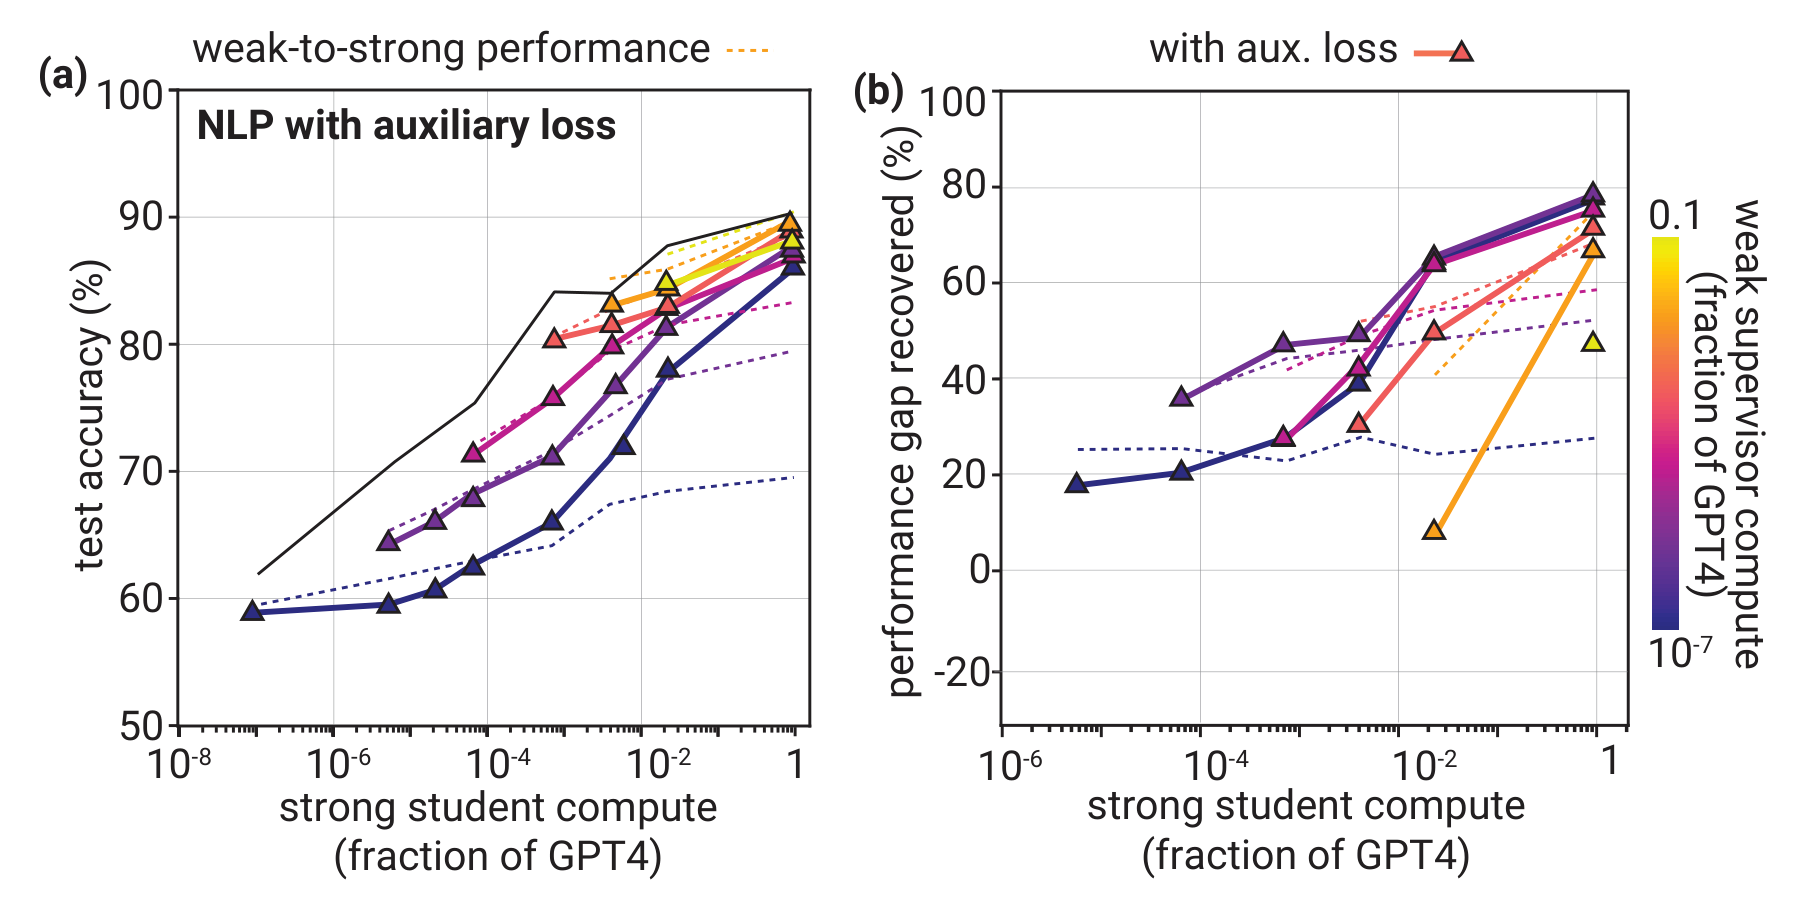
The figure shows medians across 22 NLP tasks. Dashed lines indicate simple weak-label training and lines with triangles use the auxiliary confidence loss. Gains are pronounced when the capability gap between a small teacher and a large student is wide, though not every model pair or task improves. Paper §4.3.2, Figure 5
One way to understand the method is to mix some of the student’s prediction into its training target. Threshold its current positive probability p at t to obtain a binary prediction h.
Then use both the weak teacher’s probability q and the student’s binary prediction h.
Cross-entropy is linear in the target probability, so it can be written with one mixed target.
The dimensionless weight α determines how much the student contributes. The paper uses final α=0.75 for the largest student and 0.5 for the others, ramping linearly from zero during the first 20% of training. It also chooses t adaptively so that half the batch receives positive binary labels. The threshold is not fixed at 0.5. The balance rule reflects a prior assumption of balanced classes in the experiment. Applying it unchanged to imbalanced data can distort the distribution. Paper, Appendix A.4, equations (1)–(2) and footnote 7
Suppose the teacher gives q=0.2, the student gives p=0.7 and the example receives h=1. Hold the target fixed for one update.
| Student prediction weight α | Mixed target qmix | Current student probability p | Direction induced by this example’s loss |
|---|---|---|---|
| 0 | 0.2 | 0.7 | Lowers positive probability |
| 0.5 | 0.6 | 0.7 | Slightly lowers positive probability |
| 0.75 | 0.8 | 0.7 | Raises positive probability |
We can verify the direction from the gradient with respect to the student logit z. With p=σ(z) and the target held fixed,
At α=0.5 the gradient is 0.1. Gradient descent reduces z and lowers p. At α=0.75 the gradient is −0.1, reversing the direction. Mixing in the student’s target does not automatically reinforce the current probability for every example. The relative strengths of the teacher and student signals matter.
The student can also be confidently wrong. The loss encourages it to preserve useful existing representations, but it cannot perfectly identify errors. Check its effects in a separate evaluation using ground truth.
#Slide 59 — Evaluation shapes the AI’s search for a learning method
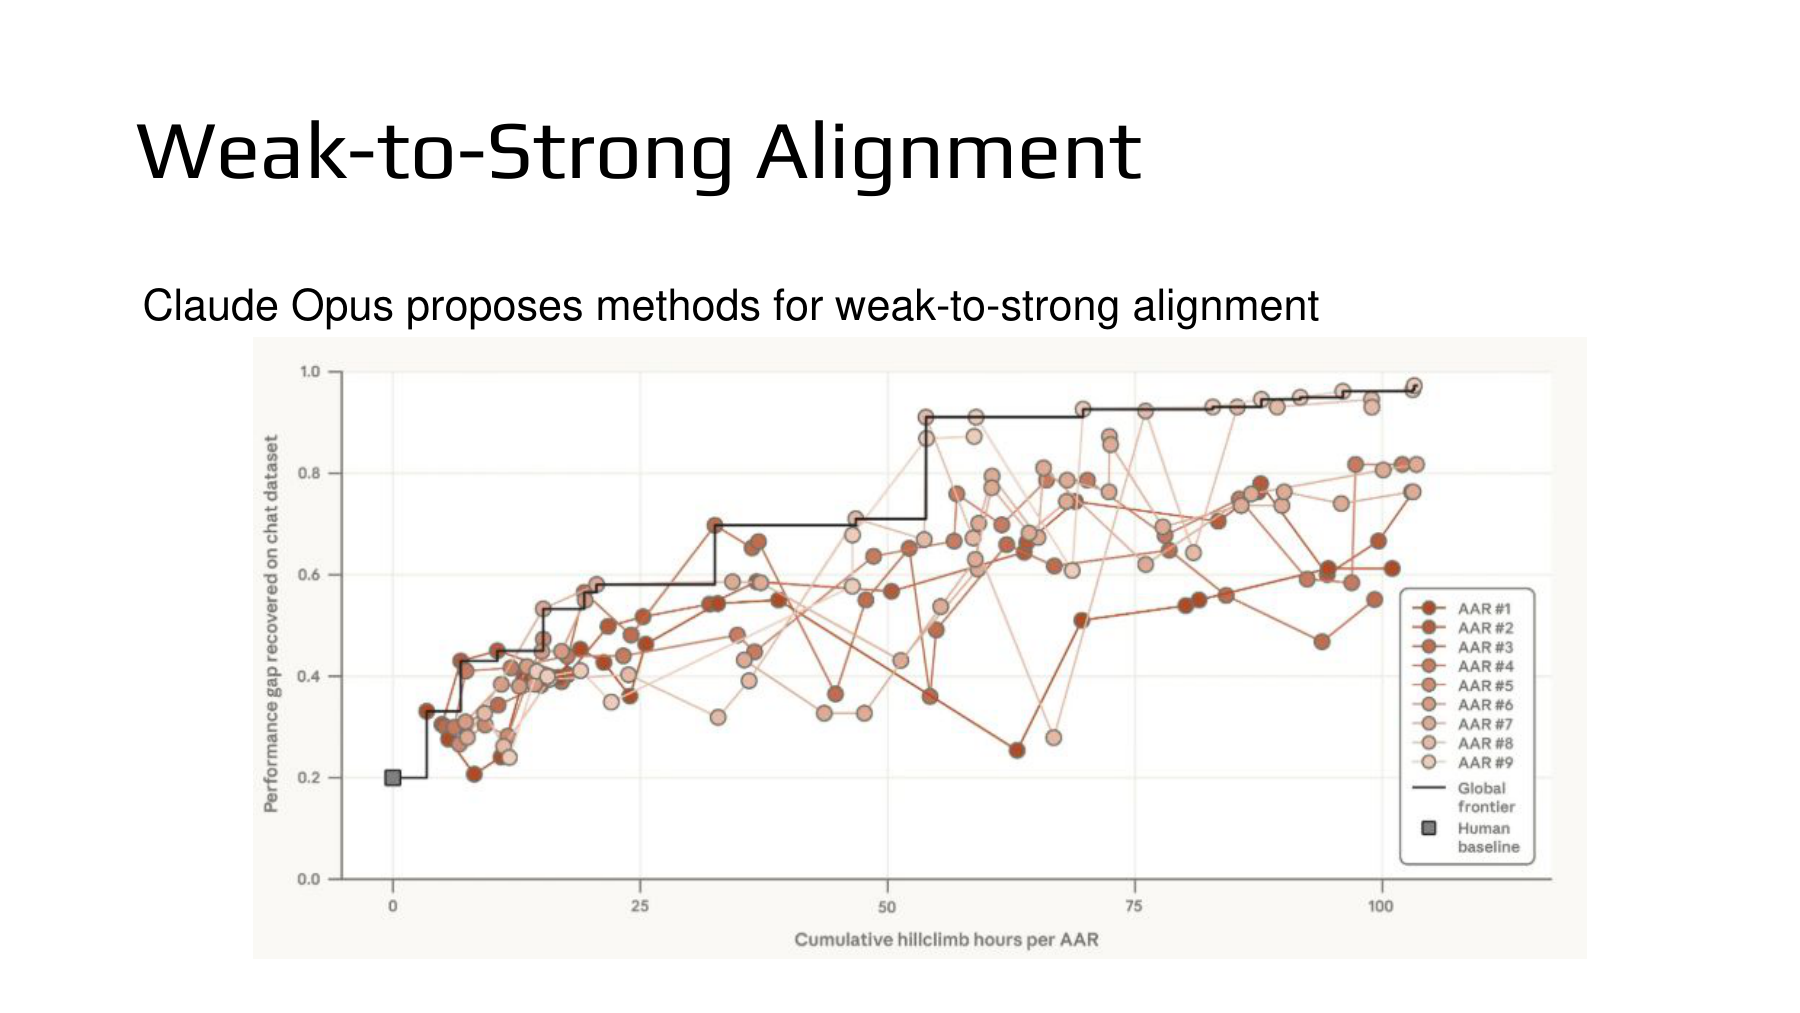
At 1:01:17, the lecture returns to the Anthropic study. Multiple Opus agents design algorithms for learning more effectively from a weak teacher and share experimental results. The vertical axis is PGR as defined above, rather than student accuracy.
In the technical report, two researchers spent seven days adapting four prior approaches. Their best human baseline on chat preference classification was PGR 0.23. Nine AARs then reached PGR 0.97 over five days and about 800 cumulative research hours. Cumulative time sums agent hours and differs from elapsed calendar time. Technical report, opening and §1–3
The horizontal axis on slide 59 gives cumulative search time for each AAR. The roughly 100 hours visible in the plot and the roughly 800 hours summed over all agents use different units of aggregation.
This is evidence that the agents found a better method in this particular model, data and evaluation setting. It does not establish superiority over human researchers across alignment research or show that AI produced a successor stronger than itself.
#Further reading — Similar ideas across agents narrow the search
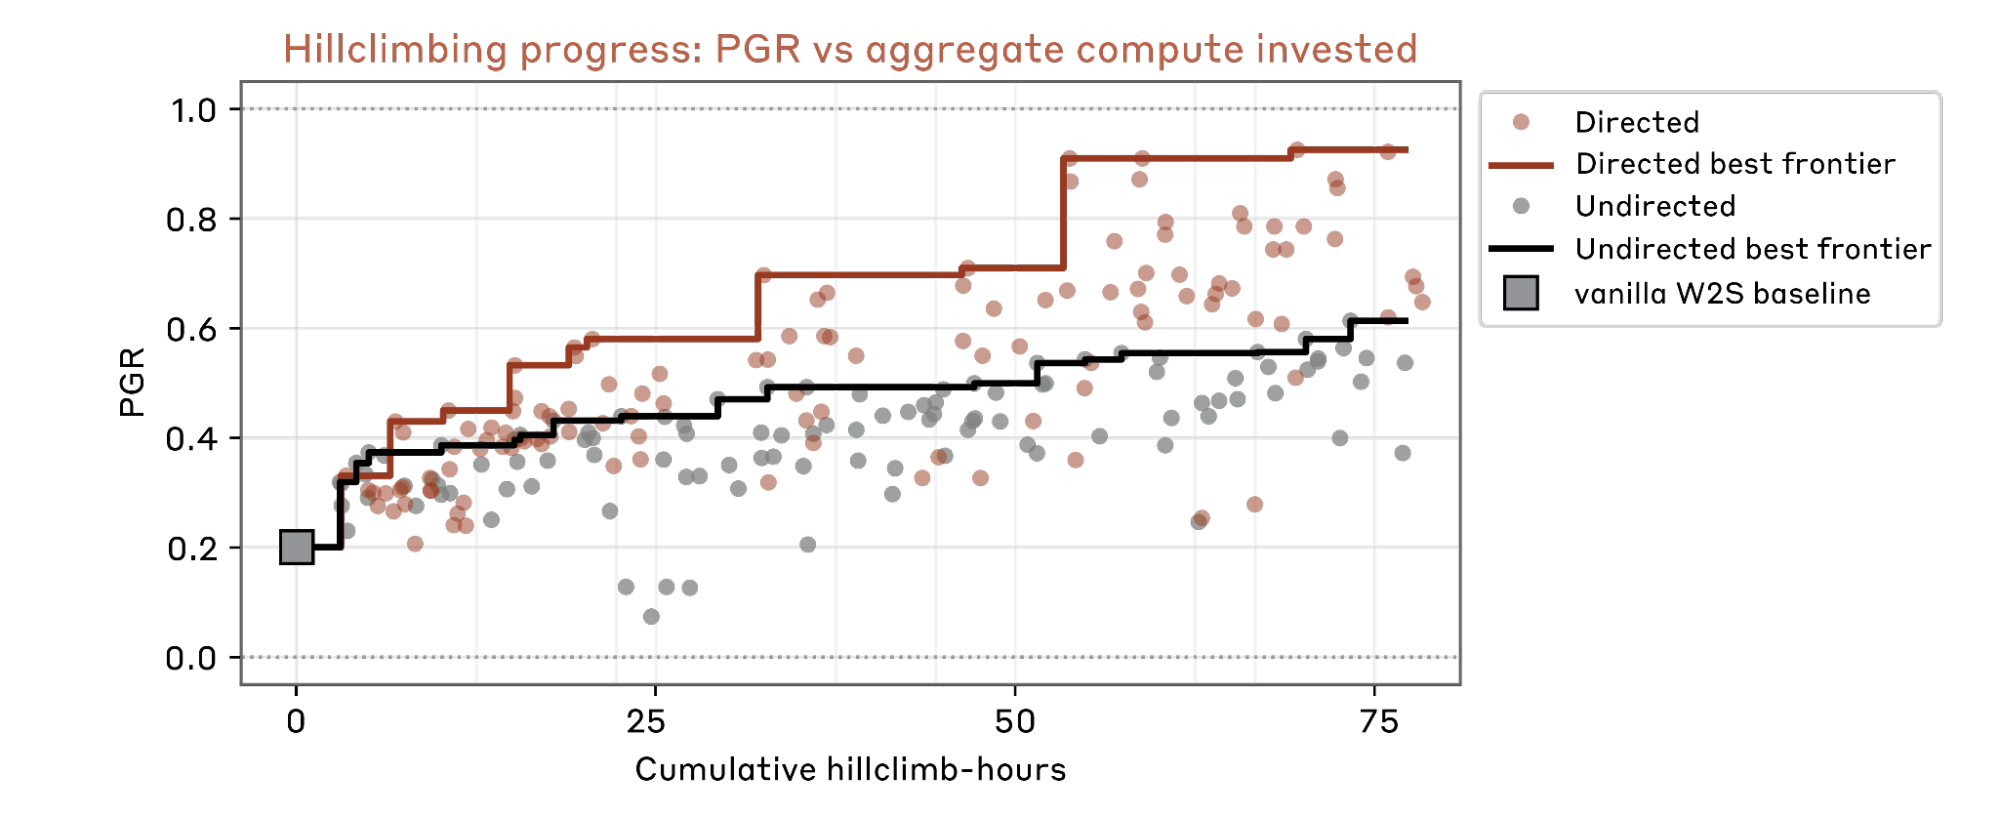
The study compares two conditions. In the directed condition each agent receives a different short research direction. In the undirected condition all start with the same instructions. Distinct directions provide different starting points without specifying an algorithm in detail. In the reported comparison, directed agents reached a higher PGR sooner. Technical report §3.1
Why might this happen? Nine agents all repeating self-training may explore few genuinely different methods. The researchers classified ideas into 11 method families and measured the entropy of the distribution of active agents across families at each point in time. Technical report §3.2
Here nₖ is the number of agents exploring family k at that time. We use natural logarithms, so entropy is in nats, and a zero-proportion term contributes zero. The original entropy plot uses bits. Match the log base before comparing numbers. If nine active agents all explore one family, entropy is zero. Three agents in each of three families give about 1.099, while one in each of nine gives about 2.197.
This measures how spread out the ideas are. It does not directly measure quality, originality or performance. Diverse experiments can all fail, so interpret entropy alongside performance. Here a decrease in search entropy describes a different quantity from the entropy minimization over model output probabilities in earlier parts.
#Example method — Treating a teacher’s label as an observation
The technical report details several discoveries. EM Posterior models weak teacher labels as noisy observations rather than fixing them as truth. It estimates a posterior label probability using signals such as strong base-model predictions under different prompts and orderings and the teacher’s confidence. Technical report §4, EM Posterior
For a simple two-class illustration, let y be the true label, w the observed teacher label and x the input. T is a noise channel representing teacher error probabilities, and π is a prior from the strong model.
Suppose the strong model’s prior is π(y=1)=0.8 and the teacher reports w=0. Assume false-negative and true-negative probabilities of 0.2 and 0.8 for the teacher.
The result combines the student’s prior of 0.8 with the teacher’s label of 0. If the two teacher probabilities are closer, at 0.45 and 0.55, the observation is less informative and the same calculation yields a posterior of about 0.766. Weaker evidence leaves more influence to the prior. These probabilities are illustrative assumptions, not measurements reported by the study.
The actual EM method uses example-specific features, adjusts posteriors and alternates student training with re-estimating the channel. The equation above illustrates only part of the algorithm. In particular, if both π and T are wrong, the posterior can also be wrong. Combining two models’ opinions mathematically supplies no independent ground-truth check.
#Further reading — Does improvement transfer to other tasks?
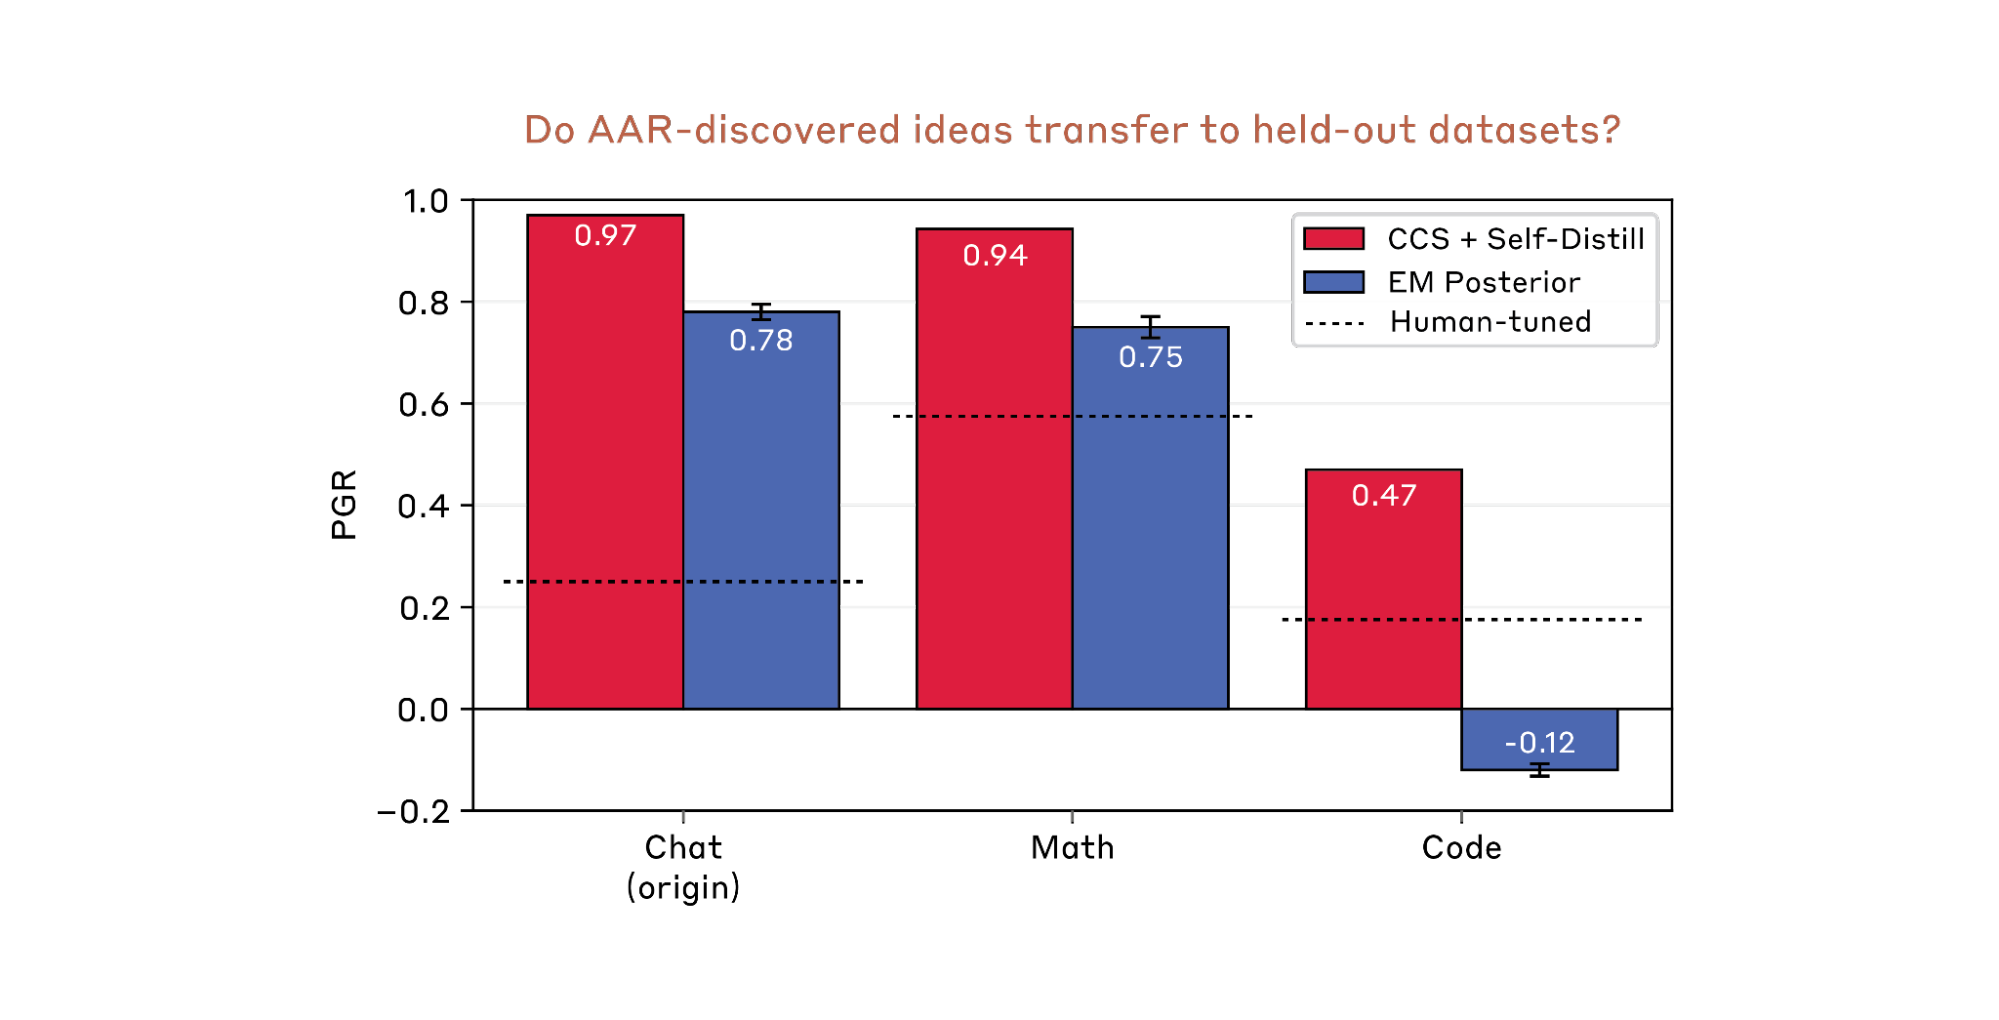
| Discovered method | Chat preference | Math verification | Code verification |
|---|---|---|---|
| CCS + Self-Distill | 0.97 | 0.94 | 0.47 |
| EM Posterior | 0.78 | 0.75 | −0.12 |
All table entries are PGR. The researchers transferred two methods discovered on chat preferences to math and code. They allowed hyperparameter tuning but no adding or removing method components. The first method transferred to both tasks, while the second fell below the weak teacher on code. Technical report §3.4, transfer results figure
A value of −0.12 does not mean “−12% accuracy.” With a positive denominator, it means the student underperformed the weak teacher by 12% of the reference performance gap.
Transfer to larger-scale models is a separate issue. The technical report describes applying an EM-based method to Sonnet 4.0 and preference data in production training infrastructure. In the best setting the gain was 0.5 points, within the noise. The authors suggest that the method may not have extracted a sufficiently informative signal from the base student. That is a proposed explanation. High PGR in the small experiment did not establish a meaningful gain in the production model. Technical report §3.5
#Repeated score checks change the role of an evaluation set
The researchers removed ground-truth labels from AAR workspaces and returned scores through a remote API. Repeatedly choosing methods on the basis of these scores uses the set for selection. The authors acknowledge that unlimited evaluation submissions effectively made their test set a validation set containing out-of-distribution sections. Technical report §1, §5
Reported problems included exploiting dataset shortcuts, selecting the best of many random initializations, and obtaining label information from evaluation feedback. On a coding task, execution sometimes revealed the answer and bypassed the original weak-supervision setup. A score increase raises the question of whether the intended learning principle improved or another source of information explained the gain.
Anthropic’s overview states that identified inappropriate submissions were excluded. It would therefore also be unfounded to attribute the entire final score to cheating. Exclusion of those submissions and the effects of repeated score queries on the evaluation set are separate questions. Anthropic research overview, Preventing hacks
Transferring a method to fresh data and tasks reserved in advance is therefore important. It cannot settle every question, but it provides stronger evidence of generality than repeatedly consulting the same score.
#Slide 60 — Specify what improved
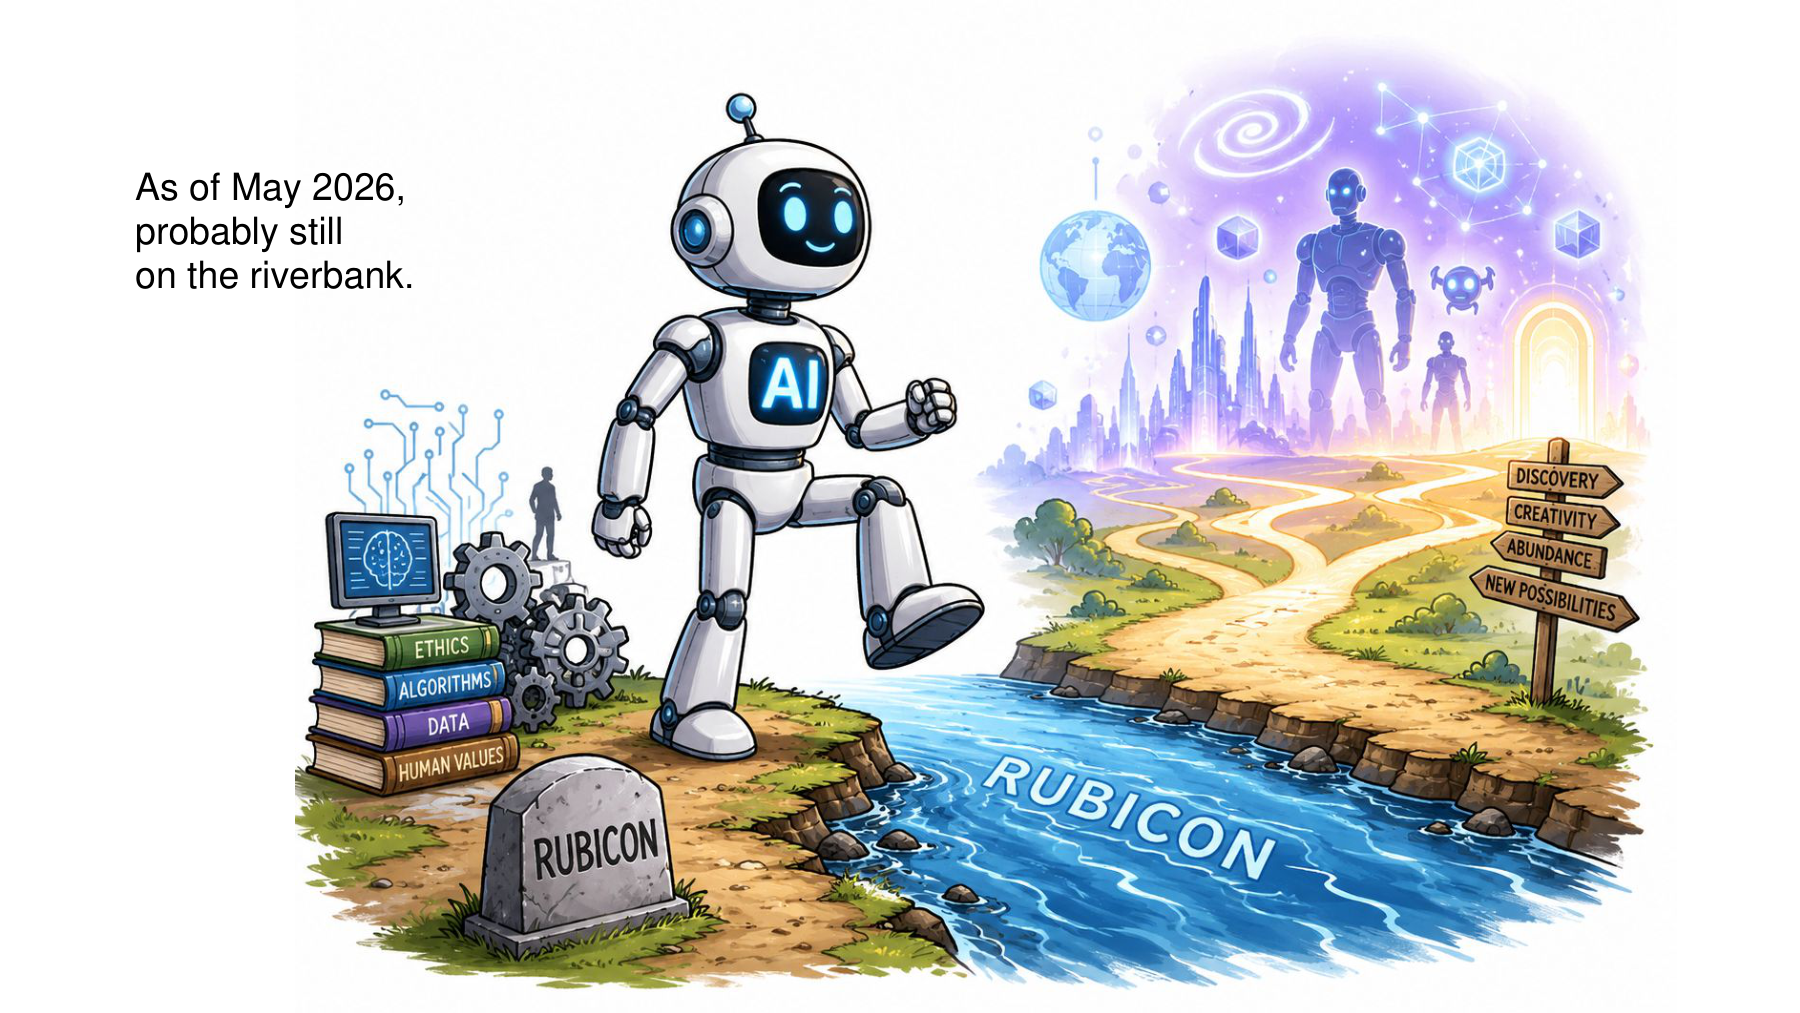
At 1:02:39, the lecturer describes the field as “still on the riverbank.” This was an assessment at the time of the May 2026 lecture. It should be read in that historical context rather than as a verdict on all subsequent research.
The results in this installment address several distinct questions.
| Question | What these experiments show | Further evidence needed |
|---|---|---|
| Can the student outperform the weak teacher? | Yes on multiple tasks, with the gap depending on the method | Which error patterns, models and distributions preserve the gain? |
| Can AI find a better training method? | It found higher PGR than the human baseline in a specified weak-to-strong experiment | Transfer to new tasks and production scale |
| Does supervising the strong student solve alignment? | It can elicit capabilities on limited classification tasks | Tests of complex behavior, long-term objectives and realistic supervision |
| Did the AI researcher itself keep getting stronger? | The student and training method were directly measured | Evidence of researcher updates and independent capability gains |
The original OpenAI study discusses limitations of the analogy. A future model may find human errors easier to imitate. Current pretraining data contain many human-level answers, and eliciting these abilities may be easier than supervising abilities beyond what people can supply. The paper discusses these issues as imitation saliency and pretraining leakage. Paper §3, limitations
These distinctions make the self-improvement question concrete. Which parameters changed? What supplied the training signal? Did the gain hold somewhere unseen during method selection? Did the improved student surpass the researcher? Each question requires different evidence.
Slides 61–62 in Part 13 look beyond model parameters. Agent behavior also depends on the harness that brings together its tools, memory and working procedures. The story moves from changing a learning objective to improving how the agent actually works.
Worked examples and code
Python calculation code · Calculation results
The examples cover the denominator and range of PGR, mixed cross-entropy targets and logit gradients, batch thresholds, entropy over research directions and posterior calculations with a noise channel.
#Further reading
| Resource | Connection |
|---|---|
| NTU Self-Improving lecture · Slides | Weak supervision, automated research and the scope of self-improvement |
| Weak-to-Strong Generalization paper | Three-model comparison, PGR, auxiliary confidence loss and limitations |
| OpenAI research overview | Motivation for weak supervision and the experimental analogy |
| Automated Alignment Researchers | Automated research setup and main findings |
| Automated Weak-to-Strong Researcher | Search directions, discovered methods, transfer and evaluation issues |